Imaging of Hard and Soft Tissues
Presentation Overview1
This session covers the diagnostic imaging techniques and interpretations associated with the hard and soft tissues of the maxillofacial region.
Lecture Objectives
The presentation progresses from basic two-dimensional radiographs to advanced three-dimensional and functional imaging techniques. The primary objective is to understand the clinical indications, diagnostic characteristics, limitations, and appropriate selection criteria for each modality based on the pathology suspected.
- Presenter: Dr. Dayea Oh, Oral and Maxillofacial Radiologist
- Acknowledgement: Lecture contents provided through the courtesy of Dr. Tom Huang
Imaging Modalities Overview2
The following imaging modalities are utilized for the assessment of hard and soft tissues:
- Intraoral radiographs
- Extraoral radiographs
- Computed tomography (CT)
- Cone beam computed tomography (CBCT)
- Magnetic resonance imaging (MRI)
- Ultrasound
- Nuclear medicine
Modality Details
- Intraoral: Bitewings, Periapicals (PAs), Occlusals
- Extraoral: OPG, Cephalometric views, facial projections
- CT: Multislice CT (MSCT), CBCT
- MRI: Dedicated soft tissue imaging
- Ultrasound: Real-time soft tissue assessment
- Nuclear Medicine: Functional imaging (SPECT, PET)
Intraoral Radiographs
Common Modalities3
- Bitewings
- Periapicals
- Occlusographs
Diagnostic Characteristics and Limitations
-
Provides a two-dimensional image of a three-dimensional object.
-
Features a limited Field of View (FOV).
-
Primarily used for detecting dental pathology, including:
- Caries
- Periodontal disease
- Periapical inflammatory pathology
-
Superimposition: 2D image of 3D object causes significant superimposition of structures, meaning things can be missed.
-
Bony Pathology: Hard to find bony abnormalities due to limited FOV; lack capacity to fully diagnose extensive bony pathologies.
-
Used to assess bony abnormalities.
-
Important Note: These radiographs cannot fully exclude the presence of disease.
Evaluation of Acute Pain4
-
Investigation of “Toothache” symptoms.
-
Intraoral radiographs are often the first line of investigation for patients presenting with acute dental pain.
-
They help localize the source of pain by identifying periapical lucencies or carious lesions.
Clinical Indications
Suspected caries (especially recurrent caries around restorations).
- Periapical inflammatory lesions.
- Periodontal bone loss assessment (localized).
[!example] Case Study: Acute Pain and Periapical Lesion
- Patient Presentation: Patient presented with toothache; emergency appointment. Heavily restored right maxillary teeth, pain around that region.
- Imaging: Periapical (PA) radiograph taken, covering crowns of right maxillary posterior teeth.
- Findings: Tooth 1:5 exhibited lucency around CEJ (decay/recurrent caries). Periapical lucency at root apex of 1:5 (inflammatory lesion, non-vital tooth). Lesion superimposed over right maxillary sinus shadow.
- Limitation: 2D image did not confirm effacement or erosion of sinus floor.
- Conclusion: Image sufficient to identify caries and periapical lesion, warranting further management.

Extraoral Radiographs
Common Radiographic Modalities5
- Panoramic Radiograph (OPG)
- Cephalometric Radiograph (Lateral / PA)
- Other Facial Views
- Oblique Lateral
- Submentovertex (SMV)
- Waters’ View
- Reverse Towne’s View
Clinical Utility and Limitations
- Provides a good diagnostic overview of the maxillofacial region.
- Features a large Field of View (FOV).
- Represents a two-dimensional image of a three-dimensional object.
- Useful for identifying bony abnormalities.
- Important Note: These views cannot fully exclude the presence of disease.
- Low Specificity: While abnormal opacities or lucencies related to the jaws can be seen, it is hard to analyze specific characteristics of the abnormality.
- 3D Relationship: Lacks value in checking the extension of bone loss or the 3D relationship of bone loss.
- Soft Tissue: Cannot check soft tissue relationships associated with lesions.
Extraoral radiographs are essential diagnostic tools used when the area of interest is too large to be captured by intraoral films or when a patient cannot open their mouth sufficiently for intraoral sensor placement.
Clinical Applications6
- Evaluation of large pathological lesions, such as cysts or tumors.
- Assessment of skeletal growth and development.
- Examination of impacted teeth and their relationship to surrounding structures.
- Evaluation of trauma to the facial bones and jaws.
- Assessment of the temporomandibular joint (TMJ).
- Assessment of generalized periodontal disease.
Panoramic Radiography7
Panoramic imaging provides a broad view of the maxilla, mandible, and surrounding structures on a single film. It is the most commonly used extraoral projection in general dentistry.
-
Advantages:
- Broad coverage of facial bones and teeth.
- Low patient radiation dose compared to a full-mouth intraoral series.
- Ease of use for patients with limited opening or gag reflex.
- Useful for patient education and visual aids.
-
Disadvantages:
- Lower resolution and detail compared to intraoral radiographs.
- Magnification and distortion inherent in the technique.
- Overlap of structures in the premolar regions.
Lateral Cephalometric Projection8
This projection is primarily used in orthodontics and orthognathic surgery to evaluate the relationship of the teeth to the jaws and the jaws to the rest of the facial skeleton.
- Key Features:
- Standardized positioning using a cephalostat to ensure reproducibility.
- Allows for precise measurement of craniofacial growth.
- Visualizes soft tissue profiles when a filter is used to attenuate the beam in the anterior region.
Posteroanterior (PA) Projection9
The PA projection is used to evaluate the skull for abnormalities, trauma, or developmental progress. Unlike the AP projection, the PA view minimizes magnification of the facial structures by placing them closer to the image receptor.
- Clinical Uses:
- Assessment of facial asymmetry.
- Identification of fractures of the mandibular body and ramus.
- Evaluation of the frontal and ethmoid sinuses.
Waters’ Projection (Occipitomental View)10
This variation of the PA projection is specifically designed to visualize the paranasal sinuses, particularly the maxillary sinuses.
- Positioning: The patient’s chin touches the receptor, and the nose is positioned approximately 1 to 2 cm away from it.
- Diagnostic Value:
- Best view for detecting sinusitis or fluid levels in the maxillary sinuses.
- Visualizes the orbital rims and zygomatic arches.
- Identifies fractures of the midface (Le Fort fractures).
Submentovertex (SMV) Projection11
The SMV projection provides a view of the base of the skull and the position of the condyles.
- Indications:
- Evaluation of the sphenoid and ethmoid sinuses.
- Assessment of the zygomatic arches (using a reduced exposure).
- Identification of the orientation of the mandibular condyles for specialized TMJ imaging.
Reverse Towne’s Projection12
This projection is specifically used to visualize the mandibular condyles and the condylar neck.
- Clinical Application:
- Identification of high condylar fractures.
- Evaluation of the condylar heads in cases of suspected pathology or displacement.
- Positioning: The patient’s head is tilted down (chin to chest) with the mouth open to bring the condyles out of the glenoid fossa.
Cone Beam Computed Tomography (CBCT)13
While often categorized separately, CBCT is a sophisticated form of extraoral imaging that provides three-dimensional reconstruction of the craniofacial complex.
- Benefits over 2D Imaging:
- Elimination of anatomical superimposition.
- Accurate 1:1 measurements for implant planning.
- Detailed visualization of the TMJ and airway.
- Localization of impacted teeth in three planes of space.
Case Studies: Extraoral Radiograph Applications
Case 1: Severe Periodontal Disease
- Findings: OPG showed all permanent teeth with generalized severe periodontal bone loss
- Characteristics: Multiple angular bony defects (not horizontal) and perio-endo bony defects extending to the apex
- Utility: Good for overview of periodontal condition, but lacks 3D relationship details
Case 2: Pathological Fracture
- Patient: Partially dentate
- Findings: Right mandible showed heterogeneous lucency with some opacities. Lytic bone/erosion observed around the inferior aspect of the right mandibular body close to the angle
- Diagnosis: Pathological fracture identified. Secondary infection could not be excluded
- Limitation: Full 3D extent of the lesion and soft tissue relationships could not be determined
Case 3: Large Cystic Lesion
- Findings: Heavily restored teeth with some periodontal bone loss. An impacted tooth was observed with a large corticated lucency around the root
- Extension: The lucency extended superiorly, superimposed over the right maxillary sinus and the orbit
- Diagnosis: Likely a cystic lesion (e.g., dentigerous cyst) due to corticated lucency and association with an impacted tooth. Odontogenic Keratocyst (OKC) could not be excluded
- Limitation: 3D extension and specific characteristics for differential diagnosis were unclear
Case 4: Expansile Tumor vs. Cyst
- Findings: Lucency involving the left mandible. Teeth 38, 37, and 36 showed very shortened roots (resorption)
- Analysis: While cysts can cause pressure resorption, tumors more commonly eat away root structures. Expansion was noted. The mandibular canal appeared preserved but displaced
- Diagnosis: Likely a tumor due to root resorption and expansion, though a large cyst was not excluded. Further imaging required
Case 5: Young Patient Cystic Lesion
- Findings: Large radiolucency in the left mandible of a young patient. Related to heavily restored tooth 75 and an unerupted/malformed 35
- Analysis: Corticated lucency with little root resorption suggested a cyst
- Differential: Radicular cyst (related to non-vital 75) vs. Dentigerous cyst (related to unerupted 35)
- Conclusion: Confirmed presence of a decent-sized pathology requiring further imaging
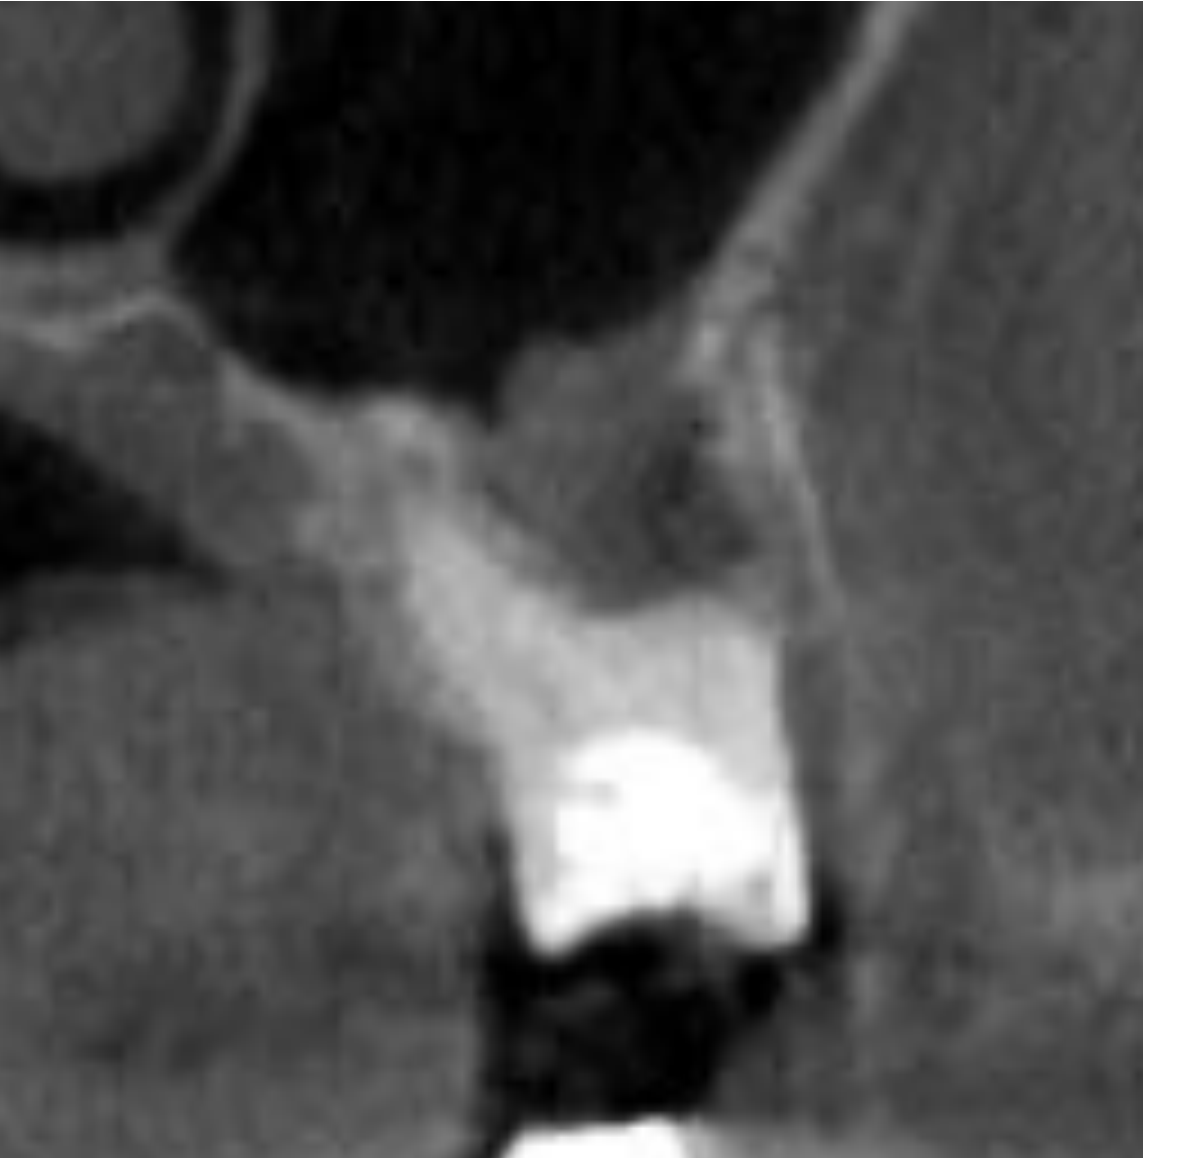
Case 6: Sinus Superimposition Ambiguity
- Findings: Partially dentate patient with heavily restored teeth. Endodontically treated tooth present. Periapical regions of maxillary molars hard to see due to alveolar recess of the sinuses
- Ambiguity: Unclear if lucency near 26/27 was an inflammatory lesion or sinus extension
- Resolution: Required Cone Beam CT for clarification



Computed Tomography1415
Multislice CT is also known as Multidetector CT (MDCT) or Spiral CT.
CT Imaging Capabilities
CT provides 3D imaging with axial, sagittal, and coronal views. Allows for reformatting (twisting, rotating) to appreciate all views of 3D structures.
Siemens SOMATOM Force16
The SOMATOM Force represents advanced CT hardware technology used for clinical imaging.
Advanced Protocoling
Capable of advanced protocoling (e.g., ultra-low dose capabilities). [
[L4 CT extras]]
MSCT Take Home Points17
- 3D Imaging: Dimensionally accurate results.
- Multiplanar Reformating: Ability to view data in different planes.
- Bony Pathology: Excellent for visualizing bone issues.
- Soft Tissue: Shows soft tissue, but not as well as MRI.
- Contrast Use: Enhances visualization of specific structures.
- Superior Speed: Fast acquisition times.
- Positioning: Typically performed in the supine position.
- Best for patients with positioning challenges (kyphotic, frail).
- Hounsfield Units (HU): Represents tissue density.
- Air: -1000
- Water: 0
Cone Beam Computed Tomography1819202122
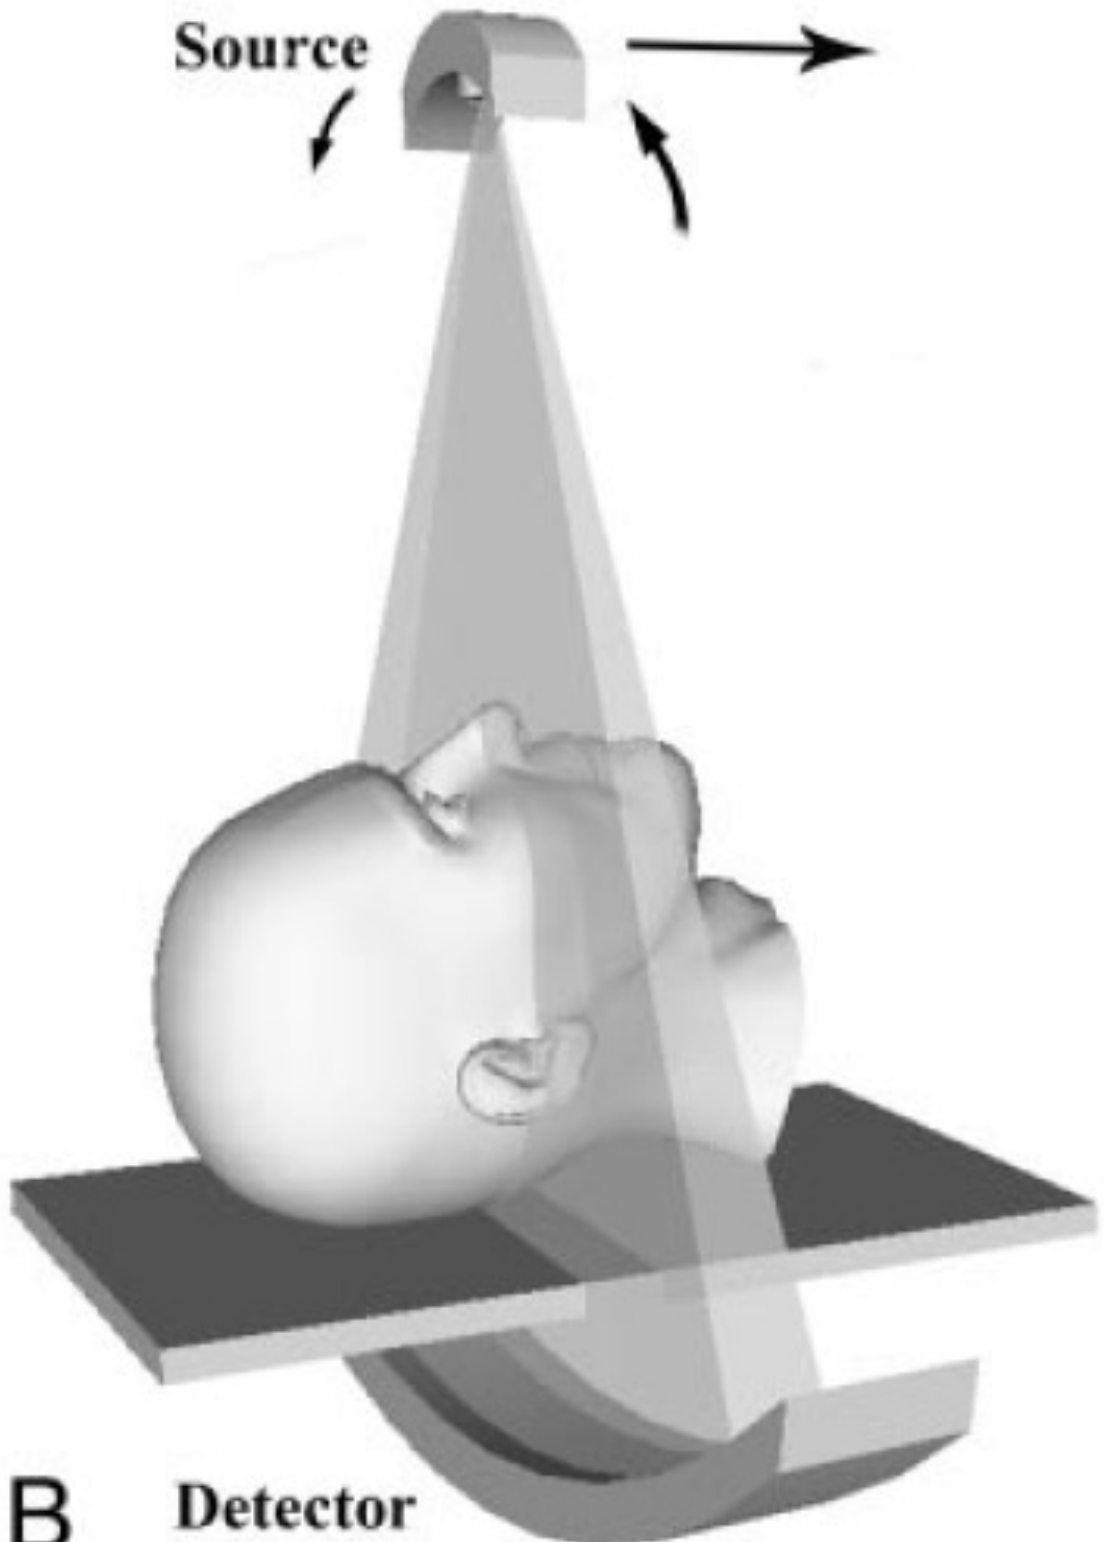
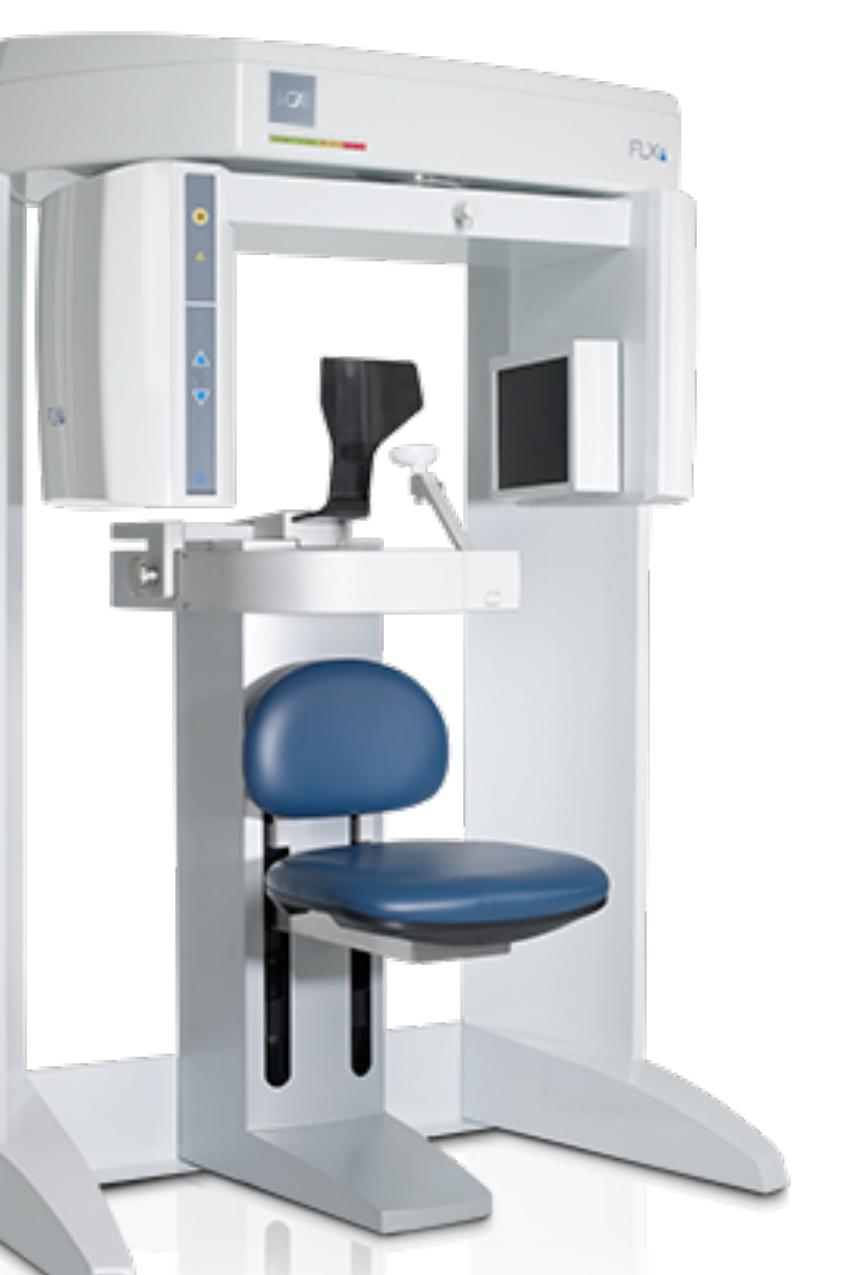
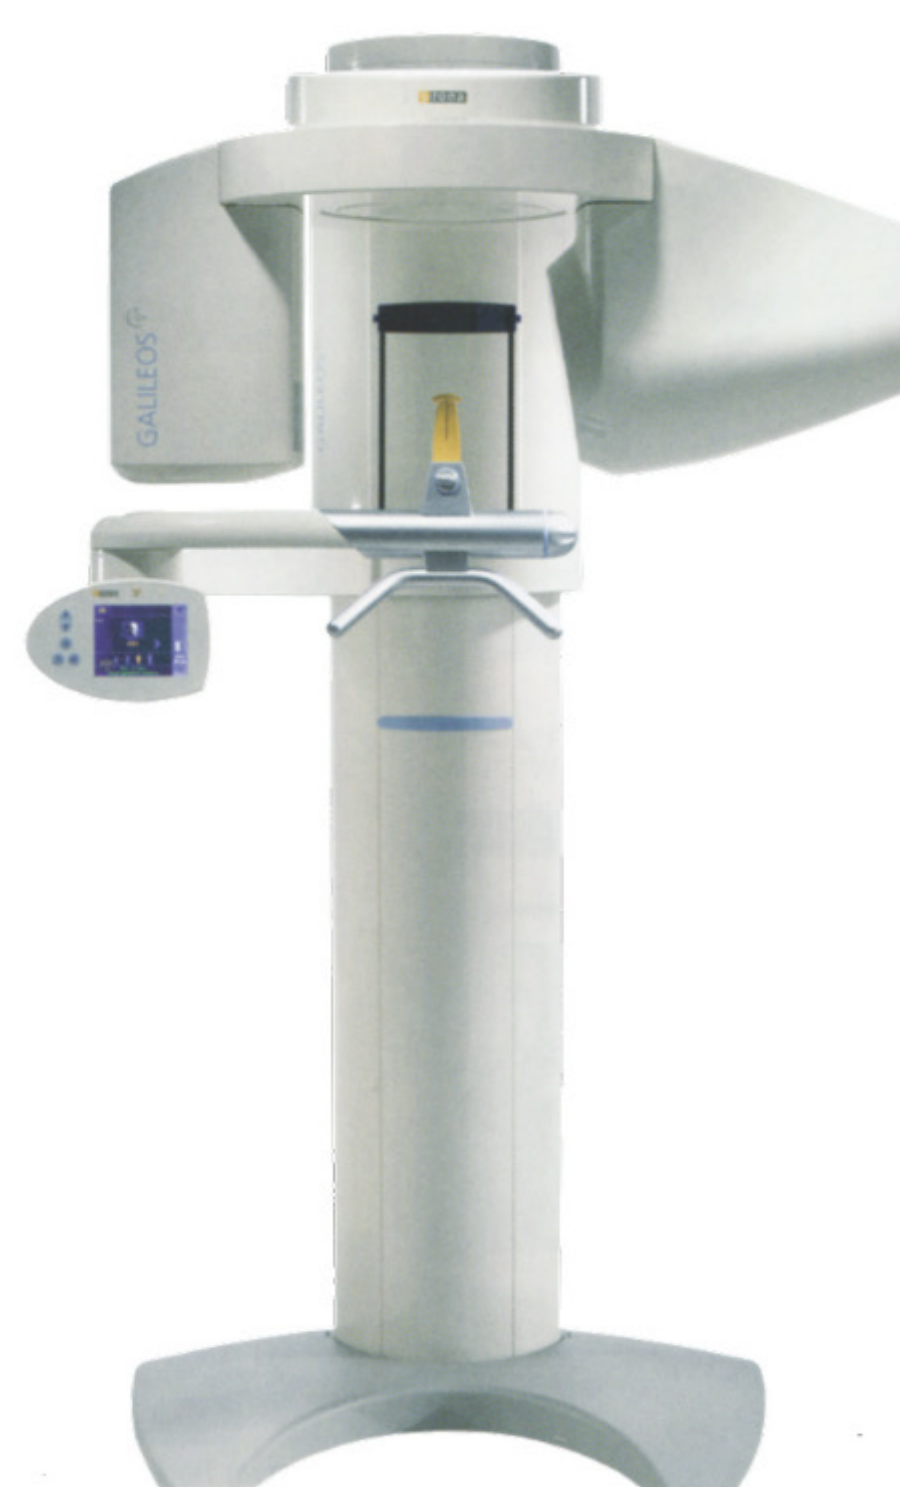
Cone Beam Volumetric Tomography (CBVT) provides a three-dimensional approach to maxillofacial imaging.
- CBCT is a modality derived from CT using a cone-shaped beam instead of a linear fan-shaped beam
- The beam rotates around the head similar to OPG rotation using a large field of view
- Patients often sit or stand erect depending on the machine (e.g., ICAT)
- The size of the beam can be increased or decreased depending on the region of interest



Radiation Dose Levels
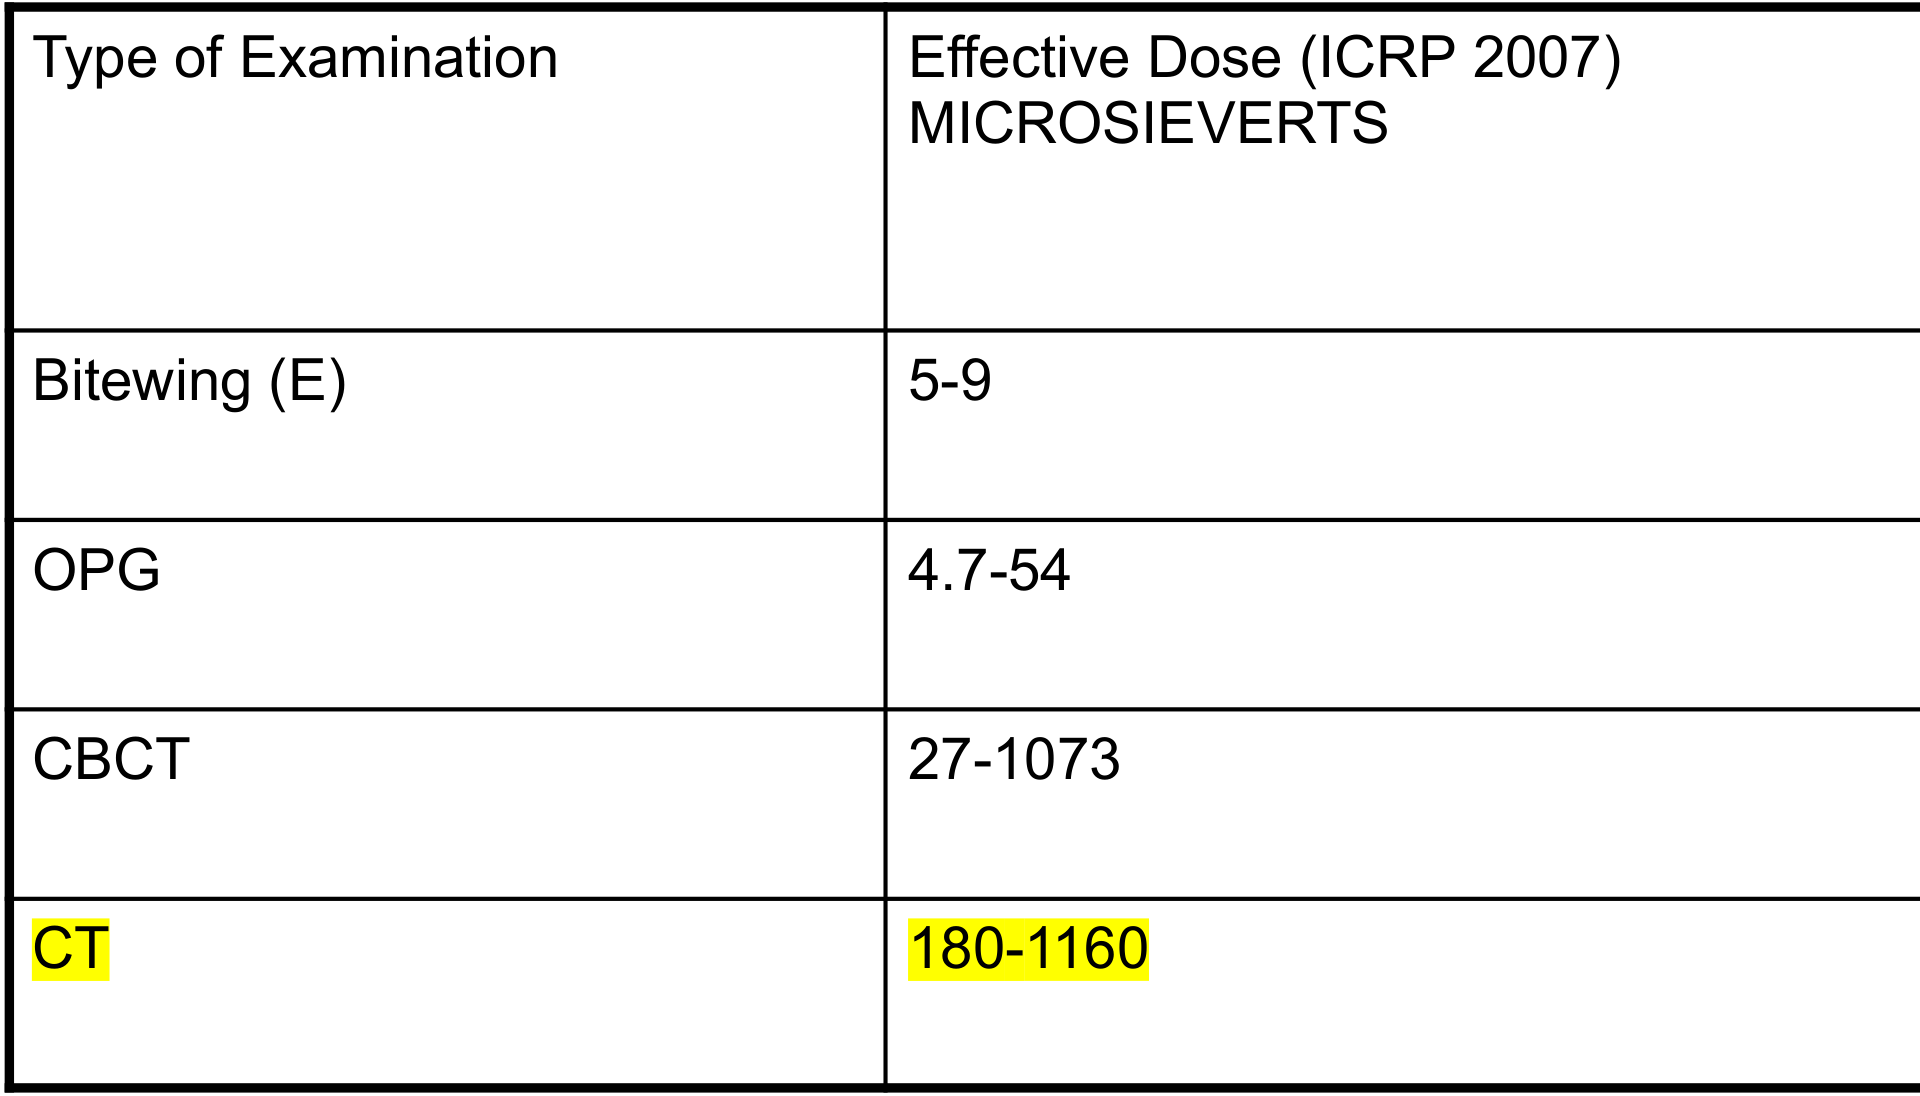




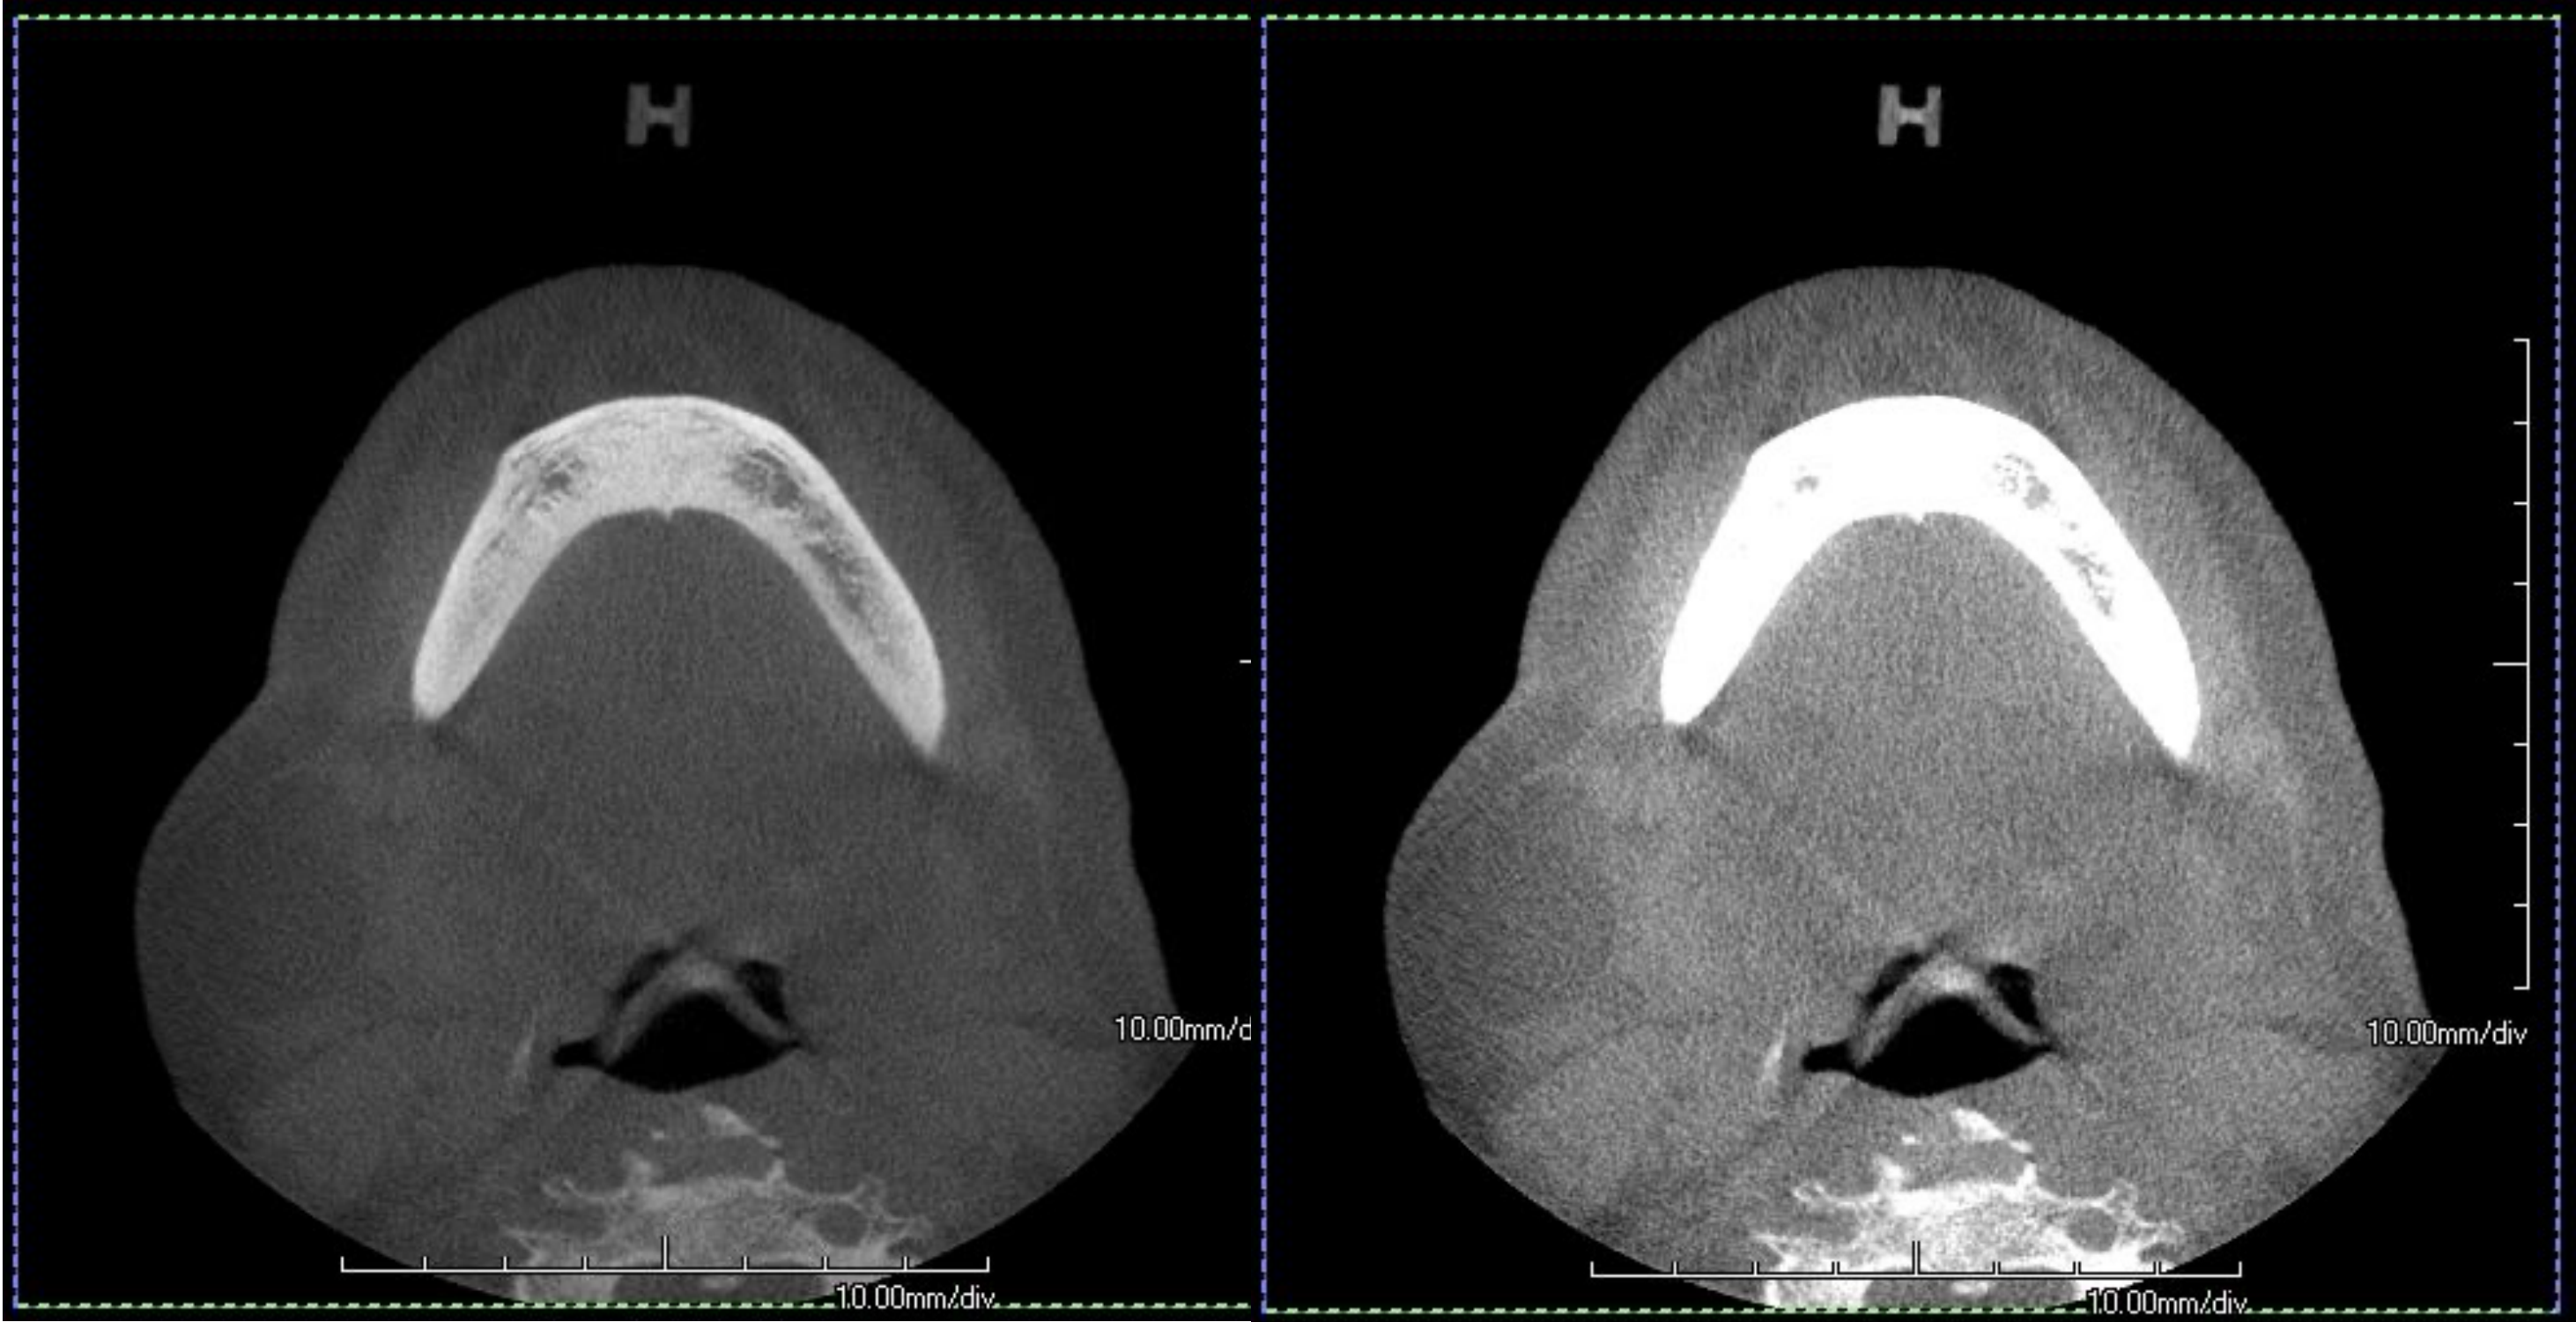
Image Fidelity and Windowing23
- Computer monitors and laser imagers for printing typically have about 8 bits of display fidelity (2^8 = 256 levels).
- The 12-bit CT images must be reduced to 8 bits to accommodate most image display hardware.
- CT scans can be windowed differently to highlight specific tissues without re-irradiating the patient.
- Window Width (W): Determines the contrast of the image; narrower windows result in greater contrast.
- Window Level (L): The CT number at the center of the window.
- Soft Tissue Windowing: Muscles have higher density than fat. Glands (e.g., parotid) usually have less density than muscles.
- Hard Tissue Windowing: Optimized for bone detail. Hard tissues appear "white out."
- Comparison: Soft tissues are seen on CT but not as accurately as MRI.
Comparative Effective Doses24
| Type of Examination | Effective Dose (ICRP 2007) Microsieverts (μSv) |
|---|---|
| Bitewing (E) | 5-9 |
| OPG | 4.7-54 |
| CBCT | 27-1073 |
| CT | 180-1160 |
Data compiled from Ludlow et al. 2008, Ngan et al. 2003, Loubele et al. 2009, Gavala et al. 2008, Gihbell et al. 2005, Visser et al. 2000, Wuomalainen et al. 2009, Okano et al. 2009, Roberts et al. 2009, Kumar et al. 2007, and Schultze et al. 2004.
- Not all CBCT scans deliver low radiation doses
- Modern CTs with careful protocoling can achieve ultra-low doses comparable to some CBCTs
Effective Doses for Adult Phantom by Exposure Protocol and Field of View25
| Protocol | Maxilla | Dentition | Mandible | Both Arches | Arches + TMJ | Standard Ceph | Average | Tukey HSD |
|---|---|---|---|---|---|---|---|---|
| Quick Scan + | 4 | 5 | 8 | 8 | 9 | 11 | 8 | C |
| Quick Scan | 20 | 23 | 34 | 39 | 43 | 54 | 36 | BC |
| Standard | 32 | 44 | 61 | 70 | 79 | 85 | 62 | B |
| High Resolution | 65 | 85 | 127 | 148 | 159 | 171 | 126 | A |
| Average | 30 | 39 | 58 | 66 | 73 | 81 | 58 | |
| Tukey HSD | C | BC | ABC | ABC | AB | A |
Source: Ludlow and Walker 2013. ANOVA p-values indicate significant variance based on protocol (p < .0001) and region (p = .0055).
- ICAT Quick Scan Plus is an ultra-low dose protocol comparable to an OPG (effective dosage ~4)
- Image quality may be reduced with ultra-low dose protocols
Multislice CT (MSCT) Protocol Variations26
Multislice CT doses are highly protocol-dependent and vary by radiologist preference.
Calculated Doses at Envision (2007 ICRP 103 tissue weights):
- Mandible: 40-99 μSv
- Maxilla: 31-77 μSv
- Orofacial (Glabella-chin): 100-180 μSv
Multidetector Computed Tomography (MDCT)27
- There is significant variation between different types of scanners.
- Imaging protocols substantially alter the doses delivered.
CBCT Radiation Dose Considerations
Comparative Dose Considerations
- Radiation dose is highly dependent on the specific CBCT unit and the protocols used.
- Not all CBCT scans deliver a low radiation dose; some may deliver doses greater than low-dose MDCT.
- A smaller field of view (FOV) in one unit may not necessarily deliver less radiation than a larger FOV in another unit.
- Significant challenges exist when comparing doses between different CBCT units or between different imaging modalities.
- Exception: High-resolution small FOV scans may have higher doses than low-resolution large FOV scans
CBCT Take Home Points
Clinical Applications and Limitations28
- 3D Morphologic Study: Provides dimensionally accurate data and allows for multiplanar reformatting.
- Dentoalveolar Disease: Highly effective for evaluating dental and alveolar structures.
- Bony Lesions: Useful for assessment, though traditional CT is often preferred for complex cases.
- Soft Tissue: Poor depiction of soft tissue structures.
- Density Measurements: Not reliable for quantitative analysis.
- No Hounsfield units are available.
- Results are affected by scattered radiation and artifacts.
Case Study: Differentiating Sinus Extension from Periapical Lesion
- Background: Patient with OPG showing unclear periapical regions for teeth 26 and 27 due to sinus superimposition
- CBCT Findings: Tooth 27 had inflammatory lesion; Tooth 26 lucency was maxillary sinus extension
- Conclusion: CBCT eliminated superimposition confirming PA lesion on 27 while clearing 26
Magnetic Resonance Imaging2930
Magnetic Resonance Imaging (MRI) is a sophisticated diagnostic tool utilized for the detailed visualization of internal structures, particularly effective for soft tissue assessment.
MRI Applications in DMFR

Clinical Indications31
- TMJ disorders: Evaluation of the articular disc and surrounding structures.
- Tumours and cysts in the head and neck:
- Jaw lesions
- Salivary gland lesions
- Paranasal sinus lesions
- Assessment of Inferior Dental Nerve (IDN)
- Infection / inflammation: For example, osteomyelitis.
- Vascular lesions
Soft Tissue Lesion Characterization Case
Case 2: Soft Tissue Lesion (Ranula)
- ==Presentation: Left facial swelling==
- ==CT Findings: Showed swelling but limited characteristic detail==
- ==MRI Findings: Provided much better detail, showing different signals within the lesion not visible on CT==
- ==Conclusion: MRI is superior for characterizing the internal nature of soft tissue lesions.==
MRI Take Home Points
Key Features and Advantages32
- Safety: No ionizing radiation and no known biological side effects.
- Contrast: Superior soft tissue contrast—ideal for soft tissue lesions and the articular disc of the TMJ.
- Versatility: Various sequences can be utilized to visualize different tissues.
- Contrast Enhancement: IV paramagnetic contrast agents (e.g., Gadolinium) can enhance anatomical and pathological structures with greater vascularity and permeability.
Limitations and Contraindications
- Patient Factors: Claustrophobia (though “non-claustrophobic” MRI options exist) and long imaging times.
- Safety Contraindications: Ferromagnetic metals are contraindicated (e.g., cardiac pacemakers, cerebral aneurysmal clips).
- Diagnostic Limitations:
- May not detect osseous changes visualized in CT.
- Calcific deposits may go undetected.
- Can overestimate the extent of tumours due to the response of adjacent tissues.
- Long imaging time increases risk of patient mobility, leading to poor quality (opposite of CT)
- Contrast Risks:
- Gadolinium-based contrast media must be used with caution in those with renal impairment; it has been associated with nephrogenic systemic fibrosis.
- Gadolinium deposition within regions of the brain has recently been discovered and is currently under investigation.
Ultrasound
Ultrasound imaging utilizes ultrasonic beams to visualize internal structures without the use of ionizing radiation. This modality relies on the principle that different tissues possess unique acoustic impedances.
Core Principles and Benefits33
- Echo Reflection: Sonic waves reflect back to the transducer based on tissue density and interface.
- Tissue Characterization: Each tissue type exhibits a characteristic echo pattern, allowing for detailed visualization.
- Real-time Imaging: Provides immediate, dynamic visual feedback during the examination.
- Cost-Effectiveness: Offers a relatively low-cost diagnostic solution compared to other advanced imaging modalities.
- Particularly cost-effective compared to MRI
Clinical Capabilities
- Soft Tissue Assessment: Highly effective for evaluating non-mineralized structures.
- Cystic vs. Solid Differentiation: Capable of distinguishing between fluid-filled cysts and solid masses.
- Hemodynamic Evaluation: Utilizes Colour Doppler ultrasound to visualize and measure blood flow.
Understanding US Signals
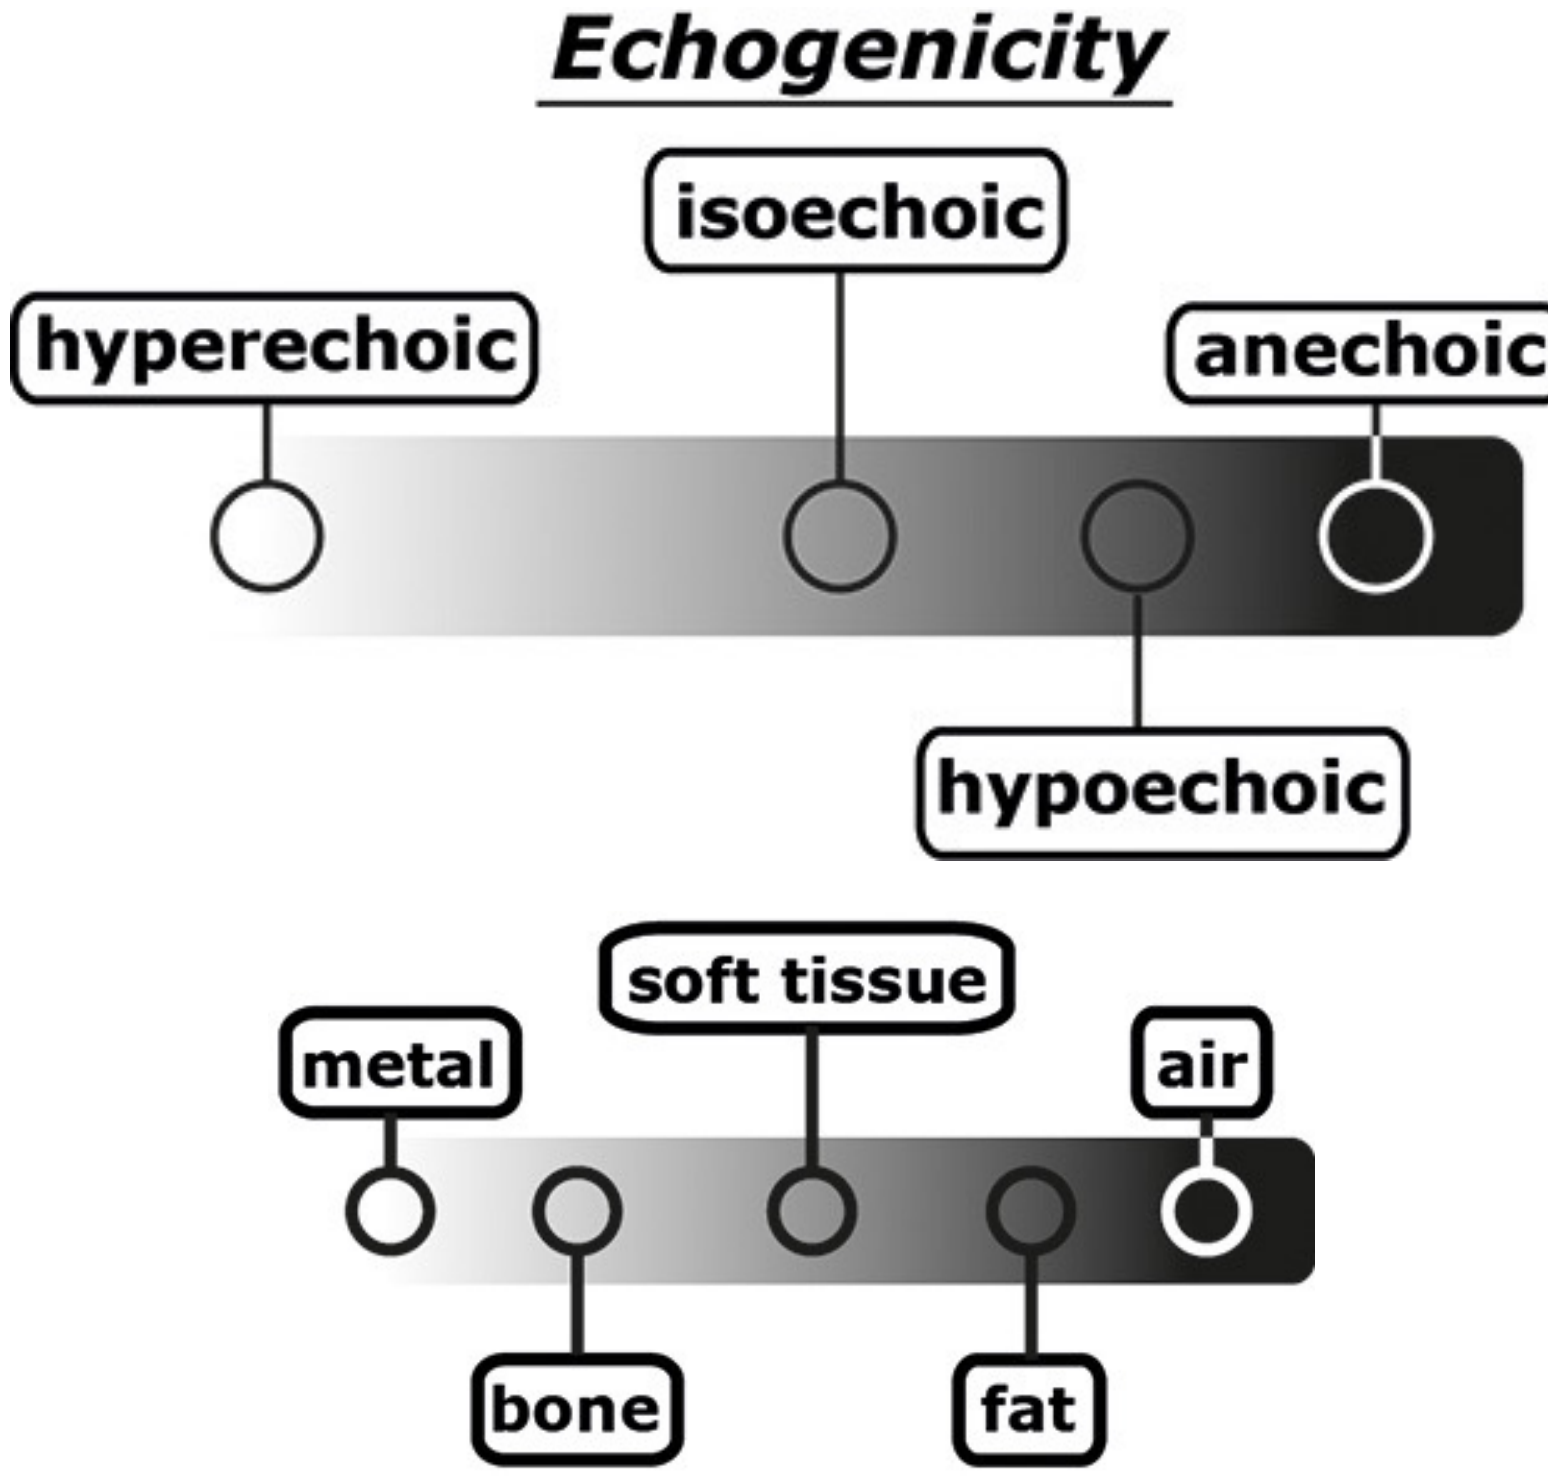
The interpretation of ultrasound images is based on the concept of echogenicity, which describes how different materials reflect sound waves.
Degrees of Echogenicity
- Hyperechoic: Areas that appear bright on the screen due to high reflection (e.g., metal, bone).
- Isoechoic: Tissues that have the same echogenicity as surrounding structures.
- Hypoechoic: Areas that appear darker than surrounding tissues due to lower reflection (e.g., certain soft tissues or fat).
- Anechoic: Areas that appear completely black because they do not reflect sound waves (e.g., air or fluid).
Material Correlation
- High Reflection (Bright): Metal and Bone.
- Intermediate Reflection: Soft tissue and Fat.
- Minimal/No Reflection (Dark): Air.

Applications of Ultrasound34
Ultrasound is employed in various clinical scenarios to evaluate head and neck pathologies and assist in diagnostic procedures.

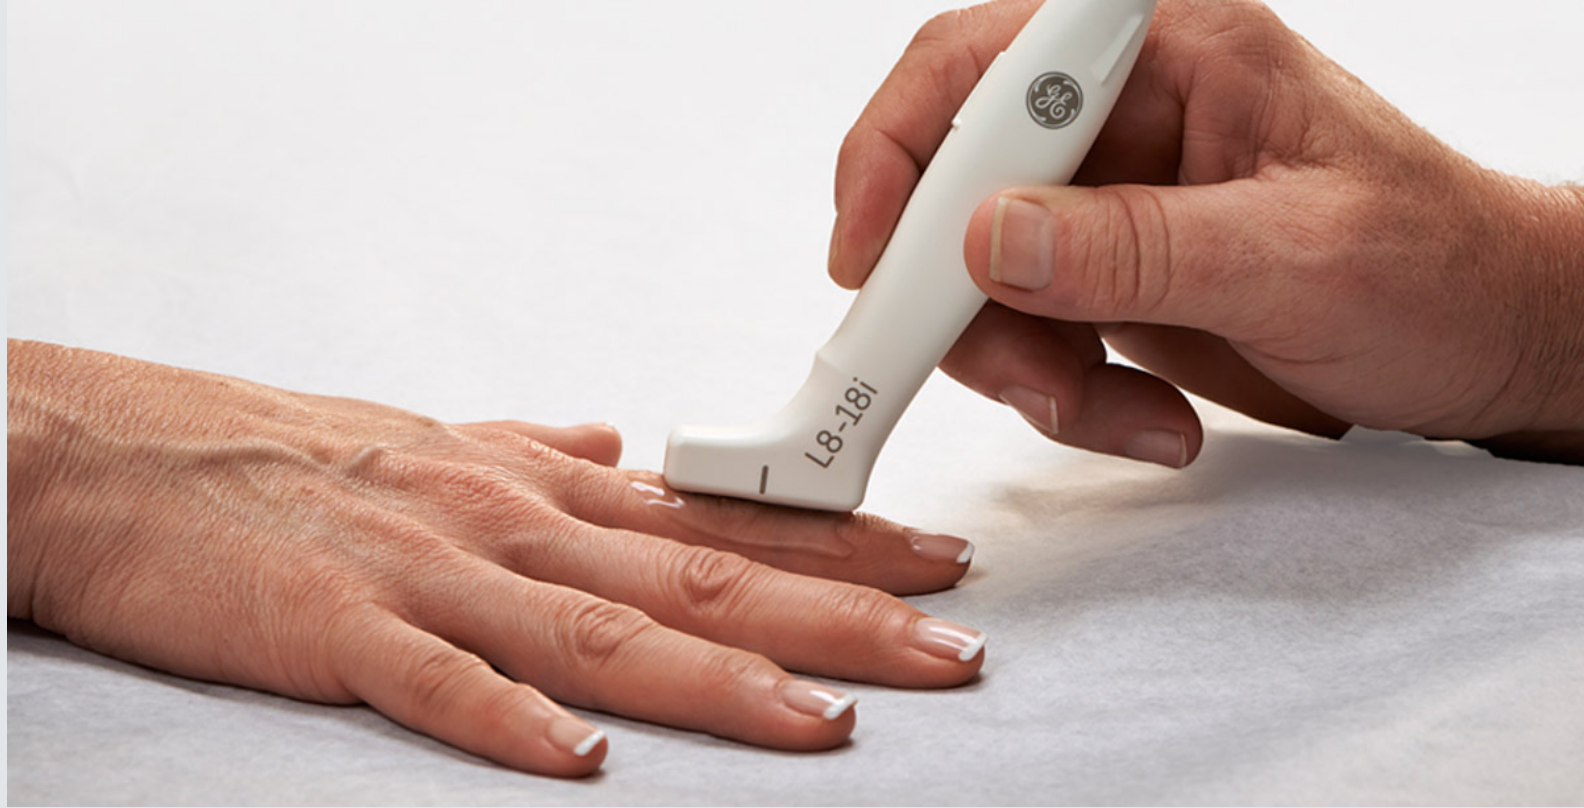
Diagnostic Indications35
- Soft Tissue Evaluation: Assessment of lumps, swellings, and localized pain or discomfort.
- Differentiation includes tumor vs. cyst vs. inflammation
- Glandular and Lymphatic Assessment: Detailed imaging of the salivary glands and cervical lymph nodes.
Interventional Guidance
- Biopsy Support: Provides real-time guidance for Fine Needle Aspiration (FNA) and core biopsies to ensure precision.
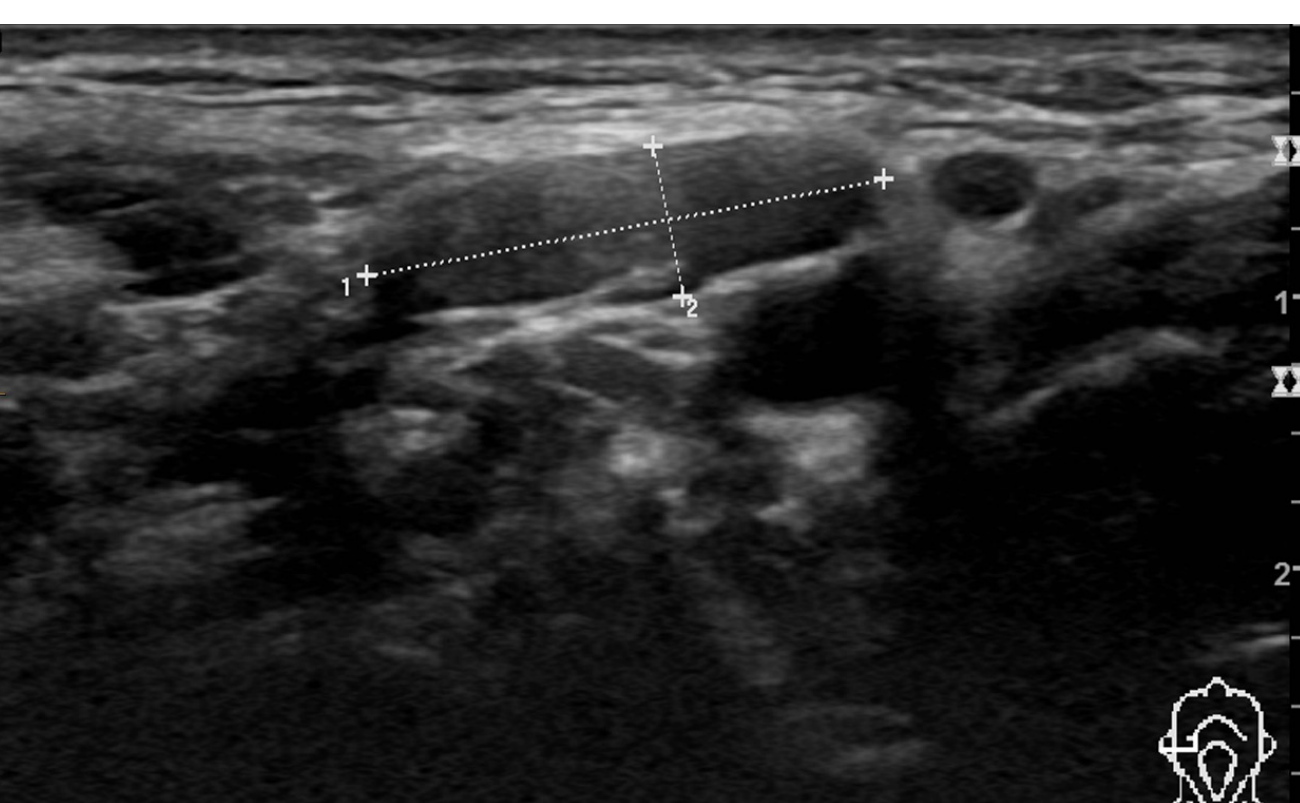
Case Study: Hypoechoic Lesion with Vascularity
- Location: Right angle region of the mandible
- Findings: Hypoechoic lesion observed
- Doppler: Color Doppler showed blood flow around the lesion
- Significance: Indicates vascularity, aiding in the differentiation of the lesion type

Nuclear Medicine36

Principles of Functional Imaging37
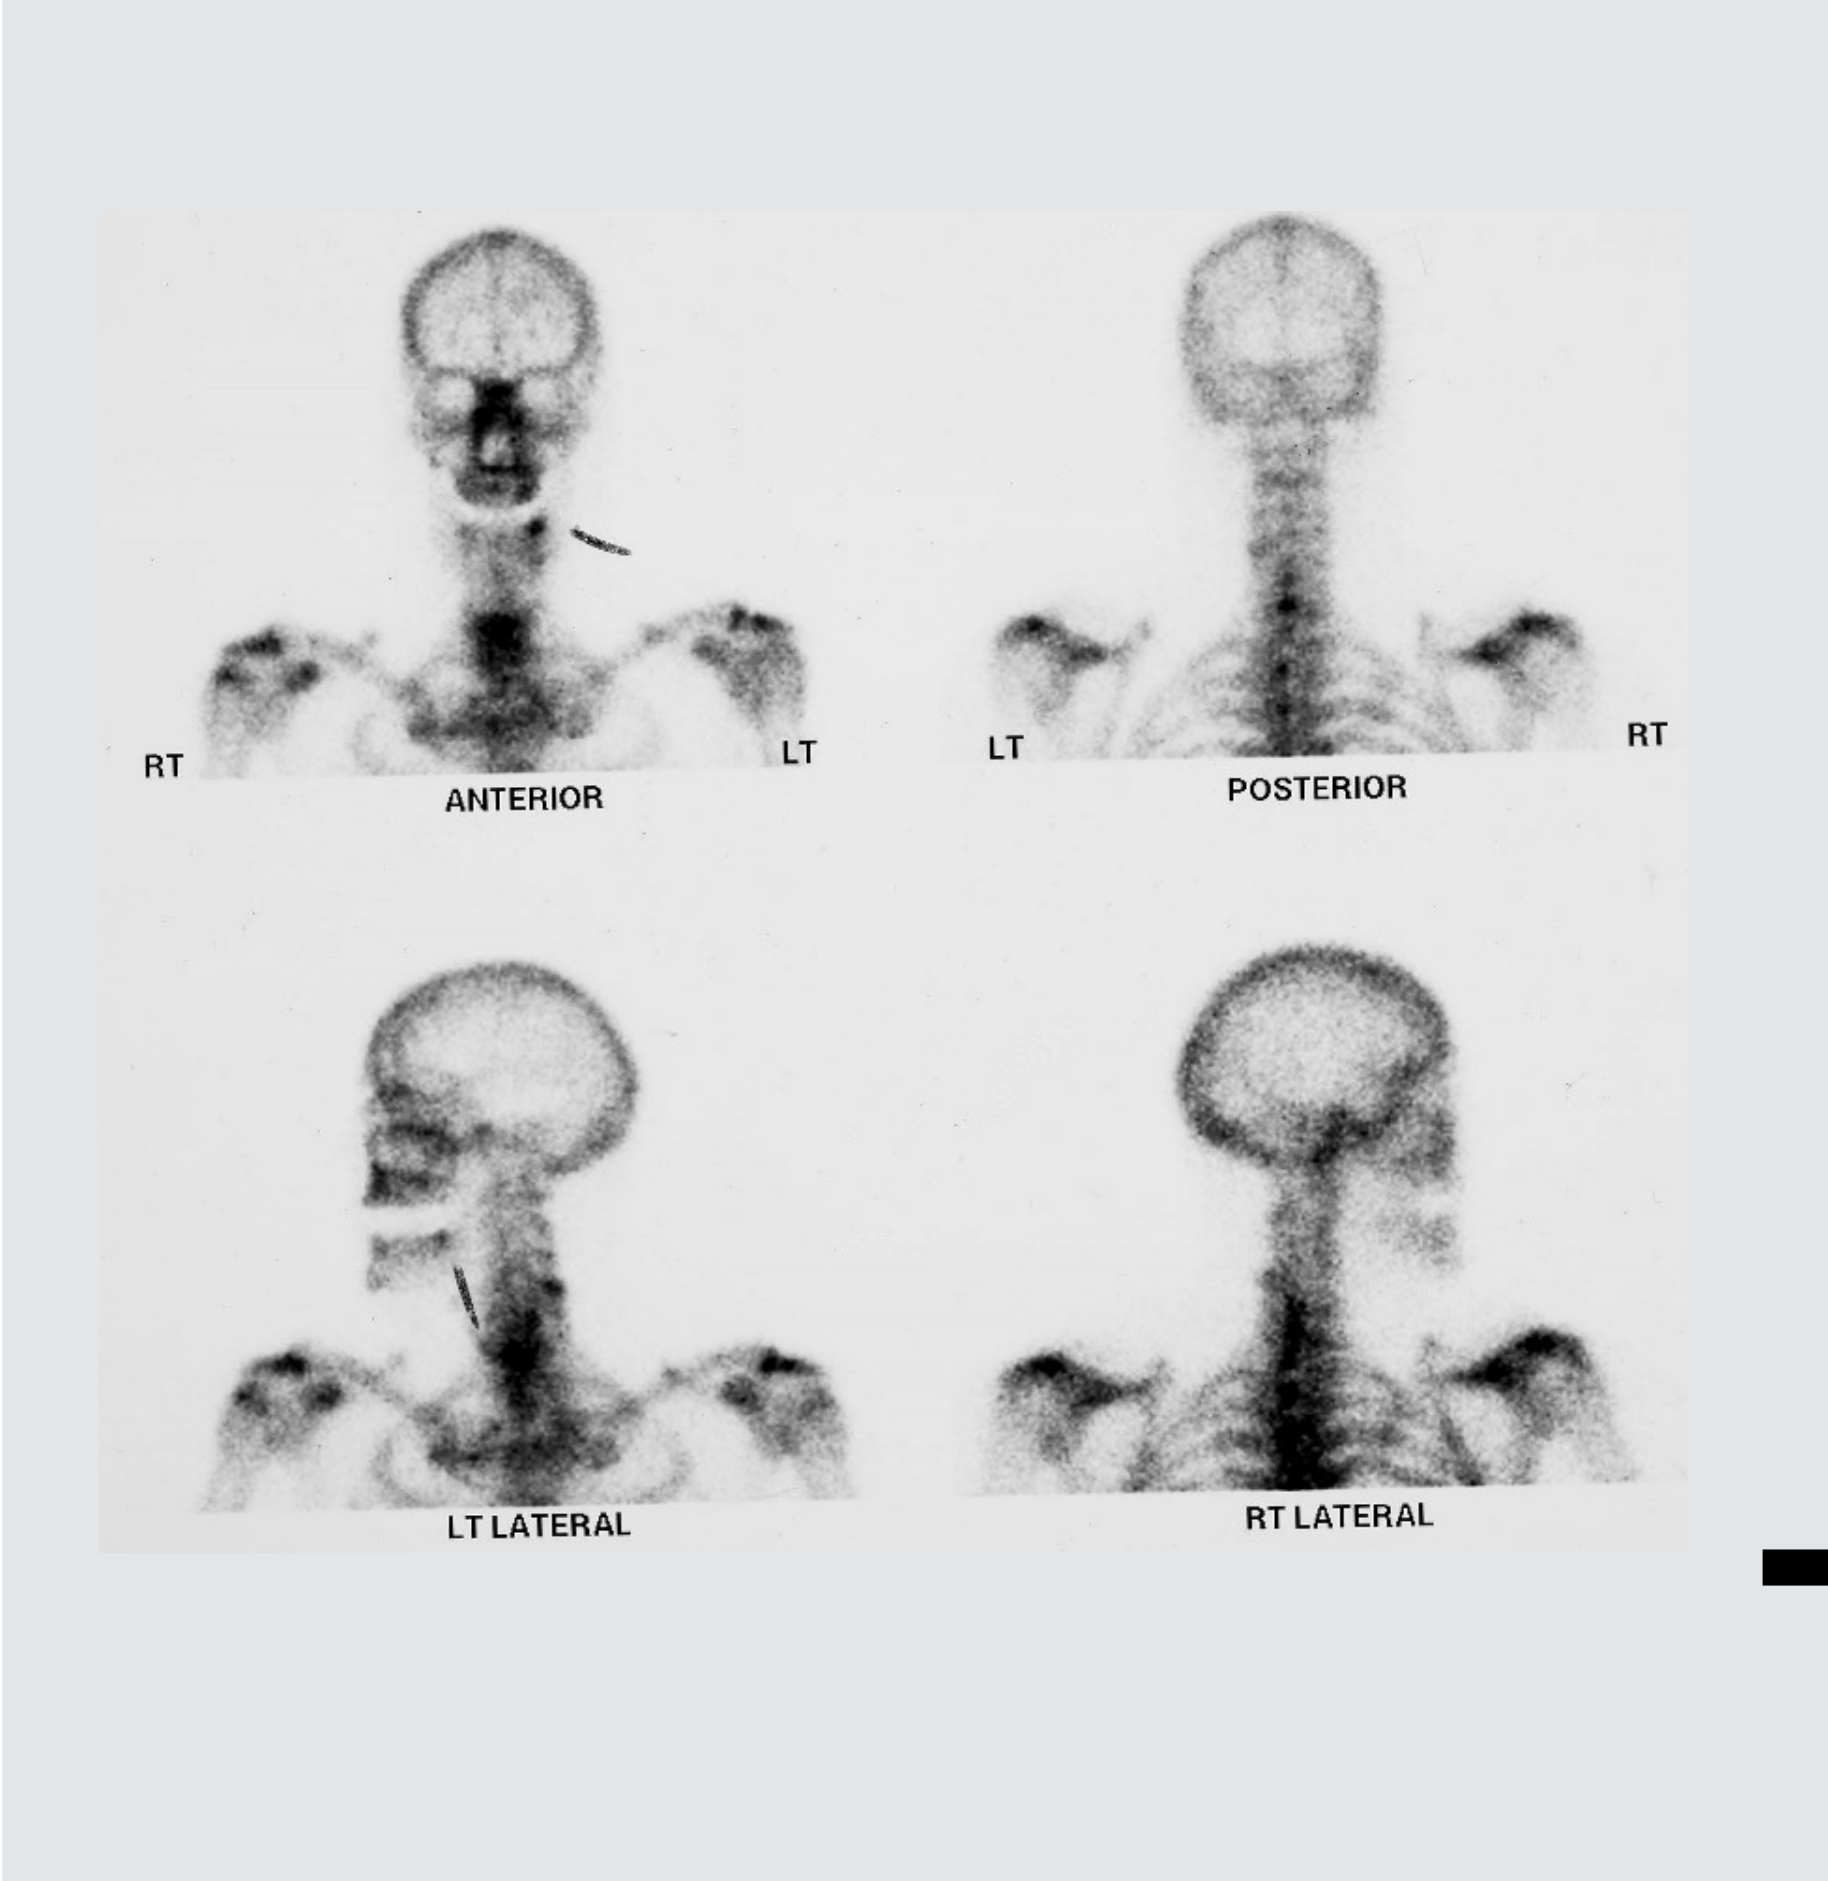
- Detects abnormal metabolic processes rather than anatomical or morphological changes.
- Rarely used in general dentistry but specialized for specific cases
- Useful for identifying pathology that may not be discernible in the early stages of disease through traditional imaging.
- Utilized to check if a lesion is highly active ("hot") or dormant
- Very high radiation imaging
Radionuclide Imaging Process
- Radiotracers: Radionuclides that emit gamma rays (e.g., Technetium 99m) are combined with a pharmaceutical to form a radiotracer.
- Distribution: The tracer is distributed to various parts of the body based on specific chemical properties.
- Detection: A gamma camera captures the emitted photons to create an image.
Single Photon Emission Computed Tomography (SPECT)
- Acquires tomographic slices by rotating a gamma camera around the patient to detect emitted gamma rays.
- The process is similar to the acquisition method used in multislice CT.
- Primary application includes bone studies
SPECT and SPECT CT


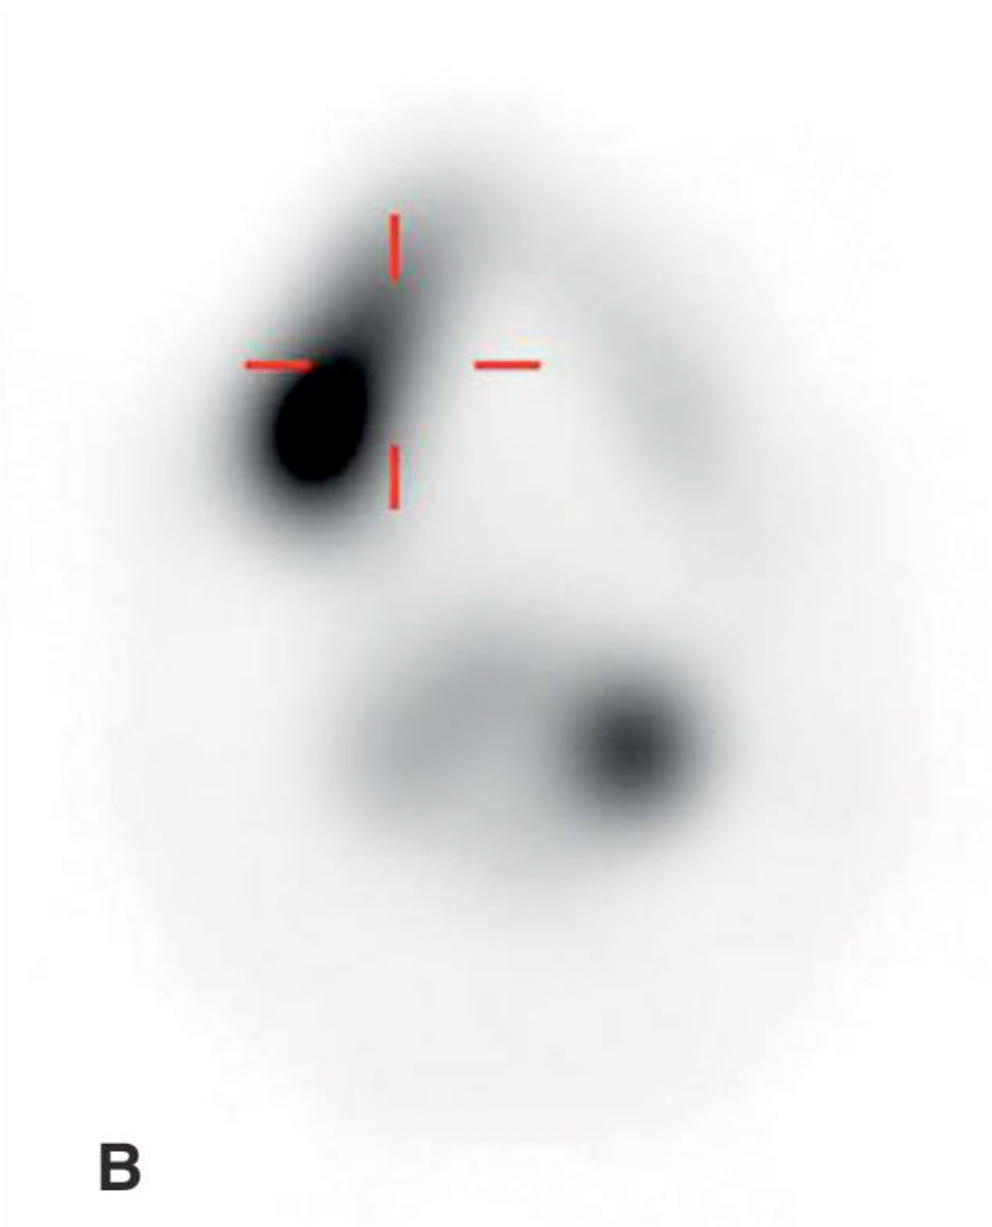
Comparative Imaging Modalities38
| SPECT | SPECT / CT | CT |
|---|---|---|
| B | C | A |
Positron Emission Tomography39
Mechanism of PET Imaging40
- Radionuclides: Uses positron-emitting radionuclides, typically combined with pharmaceuticals such as glucose or amino acids to assess metabolic processes.
- Positron Decay: After a set period, positron emission decay occurs, producing two photons that travel in opposite directions.
- Detection: A PET camera utilizes a ring of detectors to map photons that arrive simultaneously, producing functional images of organs and tissues.
Hybrid Imaging and Resolution
- Co-registration: Nuclear medicine images can be co-registered with CT or MRI images (e.g., PET/CT and PET/MRI).
- Combined Assessment: This allows for simultaneous morphological and functional imaging.
- Spatial Resolution: Offers very high spatial resolution, enabling the detection of very small lesions.
Clinical Applications
- Oncology: Detection and monitoring of various cancers.
- Cardiology: Identification of viable heart muscle following myocardial infarcts.
- Neurology: Identification of epileptic foci and the diagnosis of dementia.
- Infection: Can show active infection (also looks "hot")
- Growth Disorders: Assessing condylar hyperplasia
Case Studies: Metastatic Oral Cancer and Condylar Hyperplasia
Case 1: Metastatic Oral Cancer (SPECT/CT & PET)
- SPECT/CT: Showed a primary "hot" lesion in the right mandible and metastasis involving the spine
- PET: Used to grade the cancer. Showed a very hot lesion. CT soft tissue windowing revealed a well-contained lesion that had destructed the buccal plate


Case 2: Post-Extraction Infection
- Infection appeared "hot" on nuclear imaging due to high vascularity/activity
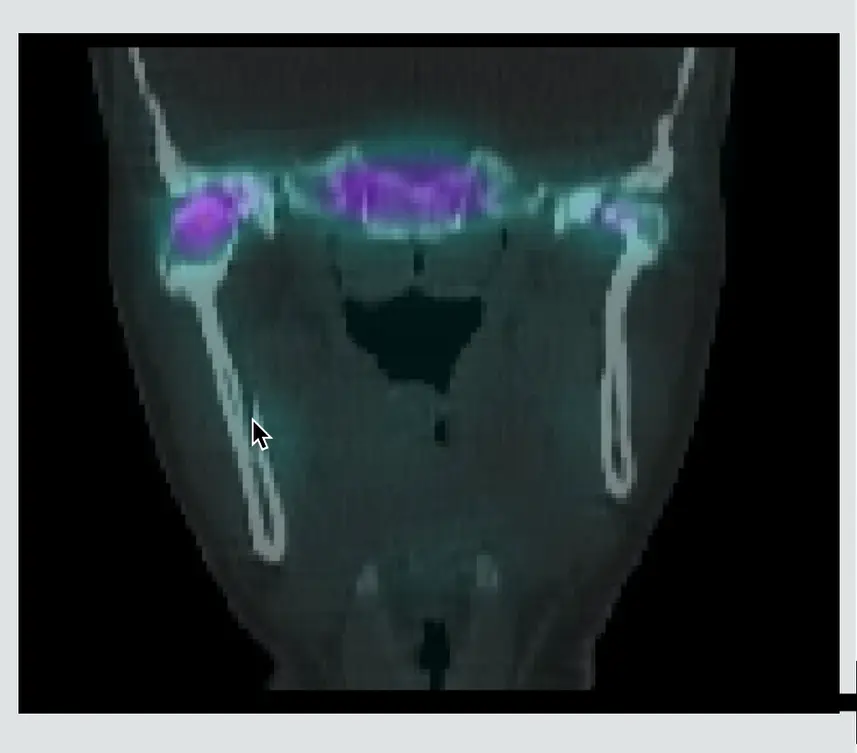
Case 3: Condylar Hyperplasia (Bone Study)
- Active right condylar head. 3D imaging showed the right condyle was much bigger than the left (hypertrophic)
- Diagnosis: Likely Osteochondroma (benign tumor). Caused enlargement of the unilateral hemi-mandible, leading to facial asymmetry

Conclusion41
- Assessment of hard tissue: Intraoral radiographs, extra oral radiographs, CBCT, MSCT
- Assessment of soft tissue: MSCT, MRI, ultrasound
- Functional imaging Techniques: SPECT,PET
Imaging Modality Selection Summary
- ==Hard Tissue (Dental Related): Intraoral radiographs are number one. Use PAs rather than bitewings for root/periapical assessment.==
- ==General Overview/Gross Pathology: Extraoral radiographs (OPG) are the next step for several sites or general picture.==
- ==3D Bony Detail: Cone Beam CT (CBCT) eliminates superimposition and is dimensionally accurate. Preferred for dental alveolar disease if OPG/Intraoral are inconclusive.==
- ==Lesion Characterization (Density): Multislice CT (MSCT) allows quantitative measurement (Hounsfield Units) of internal structure and shows some soft tissue details.==
- ==Soft Tissue Gold Standard: MRI is the most accurate for soft tissue imaging (jaws, salivary glands, TMJ) but lacks bone detail.==
- ==First Line Soft Tissue Lump: Ultrasound is useful for facial swelling/lumps to differentiate tumor, cyst, or infection (low cost, no radiation).==
- ==Functional/Specialized: Nuclear Medicine (SPECT/PET) is reserved for specialized cases like cancer grading, metastasis, or active growth disorders (condylar hyperplasia).==
For further questions, contact the lecturer via email.
Footnotes
-
Original PDF page 1: L4 Imaging of Hard and Soft Tissues, p.1 ↩
-
Original PDF page 2: L4 Imaging of Hard and Soft Tissues, p.2 ↩
-
Original PDF page 3: L4 Imaging of Hard and Soft Tissues, p.3 ↩
-
Original PDF page 4: L4 Imaging of Hard and Soft Tissues, p.4 ↩
-
Original PDF page 5: L4 Imaging of Hard and Soft Tissues, p.5 ↩
-
Original PDF page 6: L4 Imaging of Hard and Soft Tissues, p.6 ↩
-
Original PDF page 7: L4 Imaging of Hard and Soft Tissues, p.7 ↩
-
Original PDF page 8: L4 Imaging of Hard and Soft Tissues, p.8 ↩
-
Original PDF page 9: L4 Imaging of Hard and Soft Tissues, p.9 ↩
-
Original PDF page 10: L4 Imaging of Hard and Soft Tissues, p.10 ↩
-
Original PDF page 11: L4 Imaging of Hard and Soft Tissues, p.11 ↩
-
Original PDF page 12: L4 Imaging of Hard and Soft Tissues, p.12 ↩
-
Original PDF page 13: L4 Imaging of Hard and Soft Tissues, p.13 ↩
-
Original PDF page 14: L4 Imaging of Hard and Soft Tissues, p.14 ↩
-
Original PDF page 16: L4 Imaging of Hard and Soft Tissues, p.16 ↩
-
Original PDF page 15: L4 Imaging of Hard and Soft Tissues, p.15 ↩
-
Original PDF page 28: L4 Imaging of Hard and Soft Tissues, p.28 ↩
-
Original PDF page 29: L4 Imaging of Hard and Soft Tissues, p.29 ↩
-
Original PDF page 30: L4 Imaging of Hard and Soft Tissues, p.30 ↩
-
Original PDF page 31: L4 Imaging of Hard and Soft Tissues, p.31 ↩
-
Original PDF page 32: L4 Imaging of Hard and Soft Tissues, p.32 ↩
-
Original PDF page 33: L4 Imaging of Hard and Soft Tissues, p.33 ↩
-
Original PDF page 23: L4 Imaging of Hard and Soft Tissues, p.23 ↩
-
Original PDF page 34: L4 Imaging of Hard and Soft Tissues, p.34 ↩
-
Original PDF page 35: L4 Imaging of Hard and Soft Tissues, p.35 ↩
-
Original PDF page 36: L4 Imaging of Hard and Soft Tissues, p.36 ↩
-
Original PDF page 37: L4 Imaging of Hard and Soft Tissues, p.37 ↩
-
Original PDF page 38: L4 Imaging of Hard and Soft Tissues, p.38 ↩
-
Original PDF page 39: L4 Imaging of Hard and Soft Tissues, p.39 ↩
-
Original PDF page 40: L4 Imaging of Hard and Soft Tissues, p.40 ↩
-
Original PDF page 42: L4 Imaging of Hard and Soft Tissues, p.42 ↩
-
Original PDF page 54: L4 Imaging of Hard and Soft Tissues, p.54 ↩
-
Original PDF page 55: L4 Imaging of Hard and Soft Tissues, p.55 ↩
-
Original PDF page 58: L4 Imaging of Hard and Soft Tissues, p.58 ↩
-
Original PDF page 57: L4 Imaging of Hard and Soft Tissues, p.57 ↩
-
Original PDF page 60: L4 Imaging of Hard and Soft Tissues, p.60 ↩
-
Original PDF page 59: L4 Imaging of Hard and Soft Tissues, p.59 ↩
-
Original PDF page 61: L4 Imaging of Hard and Soft Tissues, p.61 ↩
-
Original PDF page 63: L4 Imaging of Hard and Soft Tissues, p.63 ↩
-
Original PDF page 62: L4 Imaging of Hard and Soft Tissues, p.62 ↩
-
Original PDF page 64: L4 Imaging of Hard and Soft Tissues, p.64 ↩