Space Analysis Introduction
Learning Objectives
This program provides:
-
An overview of mixed dentition space analysis, reviewing the possible ways to estimate the size of unerupted teeth and to judge the amount of space available
-
A review of the assumptions about growth and development on which space analysis is based
-
A detailed examination of the steps in carrying out the space analysis procedure
-
A test of your ability to interpret the results of space analysis.
Space Analysis
One of the questions you will face when assessing a mixed dentition patient, like the one whose dental alignment is seen in these photos, is whether there will be adequate space for the succedaneous teeth.
To answer the question, you must measure the space within the arches after the permanent incisors and first molars have erupted and compare it to the space required to align the as yet unerupted permanent teeth.
Because the permanent teeth have not all erupted, their size must be estimated. Space analysis usually is done early in the mixed dentition, because this is when parents first notice crowding of the erupting permanent incisors.

Available versus Required Space
The critical determination of a space analysis in the mixed dentition is to compare the space available in the dental arches to the space required for the eruption and alignment of the permanent teeth.

Space Available
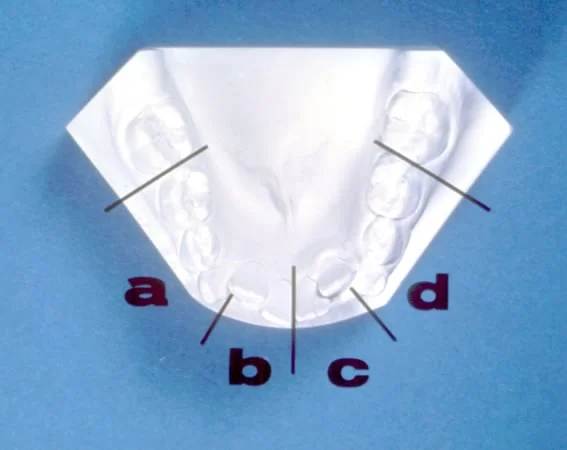
The amount of space available is defined as the distance around the arch circumference from the mesial of one permanent first molar to the mesial of the other permanent first molar. It is measured as a series of straight-line segments, as shown here. Two lateral segments, from the mesial of the first molar to a point on the alveolar process in the canine region, and two anterior segments, from the canine region point to the midline, are used.
Note that the canine region and midline points are on the alveolar process, not the teeth.
Space Required
The space required is the sum of the width of the incisors that have erupted plus the width of the canines and premolars that have not erupted.
The incisor widths are measured directly on the dental casts. Prediction of the space required for the unerupted permanent teeth (canine and premolars) can be accomplished in three basic ways:
- Measurement of the unerupted teeth on radiographs
- Estimation of the width of the unerupted teeth from a correlation with the width of the erupted lower incisors
- A combination of measurement on radiographs and correlation statistics
Radiographic Prediction
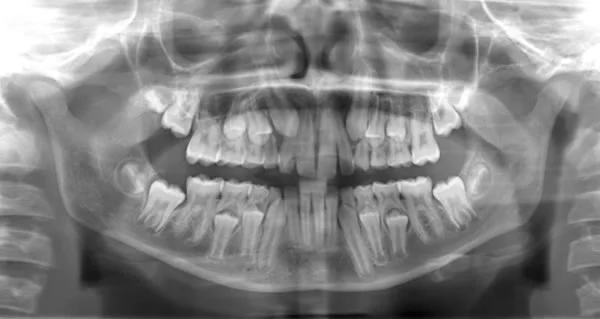
Accurate measurement of teeth on periapical radiographs requires undistorted images, and these can be difficult to obtain, especially on children in the mixed dentition due to their smaller mouths and cooperation problems.
Individual periapical radiographs usually are needed, because panoramic radiographs tend to non-uniformly distort the images of the teeth.
Even with individual images, it is often difficult to obtain an undistorted view of the canines (especially the lower ones), and this inevitably reduces the accuracy.
Radiographic Prediction (cont.)
With any type of radiograph, it is necessary to compensate for enlargement of the radiographic image. This is done by measuring the same object (such as a primary second molar) in the radiograph and on the cast. The difference in the size of the images gives the percentage of magnification, which is used to correct the magnification of the unerupted permanent teeth.
A simple proportional relationship can be set up: True width of primary molar / Apparent width of primary molar = True width of unerupted premolar / Apparent width of unerupted premolar.
Accuracy is fair to good with this method of measuring radiographs, depending on the quality of the radiographs and the position of the teeth in the arch.
The advantages are that it can be used in maxillary and mandibular arches for all ethnic groups. The disadvantages are the additional radiation required, questionable accuracy in some instances and potential behavior problems with young children.

Moyers Prediction: Proportionality Tables
The second method to determine the size of the unerupted permanent teeth uses estimations from proportionality tables. There is a reasonably good correlation between the size of the erupted permanent LOWER incisors and the unerupted canines and premolars in both dental arches.
To utilize the Moyers method, the mesiodistal width of the lower incisors is measured, and this number is used along with the table below to predict the size of BOTH the lower and upper unerupted canines and premolars.

Tanaka-Johnston Prediction: Proportionality Formulas
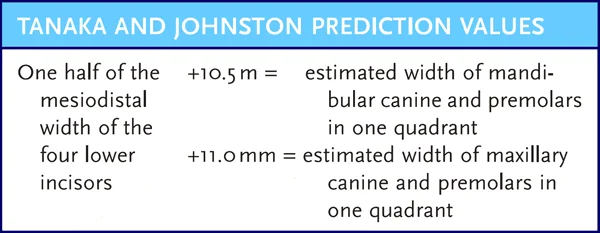
Tanaka and Johnston developed another way to use the width of the lower incisors to predict the size of unerupted canines and premolars. The Tanaka-Johnston method has good accuracy, despite a small bias toward overestimating the unerupted tooth sizes.
It requires neither radiographs nor reference tables, which makes it very convenient. This is essentially another proportionality table method, but it has been greatly simplified so that no table is necessary—just two simple formulas that are easy to recall or that can be printed right on the analysis form.
Hixon-Oldfather Prediction: Combination Method
The third method is a combination of radiographic and proportionality table methods.
The major problem with using radiographic images is obtaining a good canine view. The size of permanent incisors measured from the dental casts and the size of unerupted premolars measured from periapical radiographs can be used together to predict the size of the unerupted canines.
This approach was developed by Hixon and Oldfather and revised and improved by Staley and Kerber. Their graph allows canine and premolar widths to be read directly from the sum of lower incisor widths on the cast and premolar widths on the radiographs.
Even though this method is quite accurate in its predictions for Caucasian children of northern European descent, because that was the group used to derive the prediction tables, the accuracy is somewhat questionable for children of African or Asian descent. Two other significant shortcomings: it can be used only for the mandibular arch and requires periapical radiographs.

Tanaka-Johnston Advantages
For general clinical use, the most practical approach to space analysis is the Tanaka and Johnston method because it:
- requires no radiographs
- requires no lengthy prediction tables, graphs or equations
- can be used for both arches
- is reasonably predictable (good correlation)
The method was derived using a sample of Caucasian children, which must be considered when using the technique in children of different ethnicities.
Assumptions
Tanaka-Johnston Assumptions: Tooth Size Correlation
When doing a mixed dentition space analysis, you must keep the assumptions in mind that underlie the procedure. Consider the assumptions that go with the use of the Tanaka-Johnston method.
The first assumption is that there is a correlation between the size of the erupted mandibular incisors and the size of the remaining unerupted maxillary and mandibular canines and premolars.
A significant correlation has been demonstrated by numerous researchers, but there are individual variations in the size of teeth. Maxillary lateral incisors and mandibular second premolars are the most variable teeth (except third molars, which do not figure in space analysis). If these teeth are obviously large or small, the correlations will be incorrect.
Tanaka and Johnston Assumptions: Caucasian Population
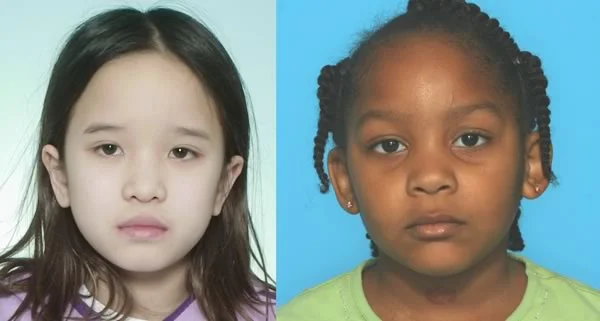
A second assumption is that your patient fits the population that was used to derive the prediction tables or formula. Because tooth size and morphology are distinct racial and ethnic traits, this must be taken into account for accurate prediction in any successful space analysis.
The prediction values used for the method advocated in this program were derived from a sample of children of northern European descent. You must decide if your patient is a member of the same population group. The prediction formulas are not nearly as accurate for other populations.
 Image 1: For this child, space analysis based on averages for children of northern European descent may be less accurate. Image 1: For this child, space analysis based on averages for children of northern European descent may be less accurate. |  Image 2: For this child also, space analysis based on averages for children of northern European descent may be less accurate. Image 2: For this child also, space analysis based on averages for children of northern European descent may be less accurate. |
Patient from Different Population
If your patient does not fit the population to which the prediction formulas apply, you can use one of three strategies:
- complete the space analysis recognizing these limitations, and use great care when interpreting your results.
- use a different prediction table or formula that is specific for your patient’s racial group, if such a table exists; or
- use the individualized radiographic technique described earlier. Use of multiple periapical radiographs is not justified in all cases, but may be appropriate for these selected patients.
Tanaka-Johnston Assumptions: Normal Development
A third assumption about space required is that all succedaneous teeth are developing normally (image 1).
This may be difficult to ascertain in some early mixed dentition children, since the premolars are often late in forming and not visible on radiographs. It makes no sense to assume normal-sized teeth if the presence of all the teeth is not assured, or if there are obvious anomalies in tooth size (image 2) when the radiographs are examined.
 Image 1: Panoramic radiograph showing missing mandibular second premolars in the mixed dentition—obviously, space analysis must take this into consideration. Image 1: Panoramic radiograph showing missing mandibular second premolars in the mixed dentition—obviously, space analysis must take this into consideration. |  Image 2: Maxillary peg lateral incisors, which will affect the amount of space available in the maxillary arch. The variability of maxillary laterals is why only lower incisor widths are used in the prediction formulas. Image 2: Maxillary peg lateral incisors, which will affect the amount of space available in the maxillary arch. The variability of maxillary laterals is why only lower incisor widths are used in the prediction formulas. |
General Assumptions: Space Available
There are also some important assumptions about the amount of space available. Obviously, space analysis only works if space available can be predicted accurately.
Space analysis assumes that arch dimensions DO NOT increase during growth. Of course, the maxilla and mandible grow and increase in size, but this growth occurs in areas away from the dentition (for example, distal to the first molar), so that little extra space for the teeth is created. For normal growth and development, this is a valid assumption.

General Assumptions: Stable Position of Incisors
Another important assumption is that the position of the incisors will not change in a way that increases or decreases arch circumference and available space.
In fact, after the eruption of the lateral incisors, little increase in arch circumference can be expected and incisor stability can be assumed—but only in children with a Class I growth pattern, so assessment of space available is less accurate in Class II and Class III children.
In a child with a Class II growth pattern, the lower incisors tend to tip facially, increasing space in the lower arch, while the upper incisors may move either facially or lingually; in a Class III growth pattern, the lower incisors are likely to tip lingually, decreasing space in the lower arch, while the upper incisors often tip facially, increasing space in the upper arch.
Transition of Molar Relationships
Because the primary molars are larger than the premolars that replace them (image 1), the position of the permanent first molars can be expected to change when the primary second molars are lost. The space analysis procedure assumes that the mesial shift of the first molars can be predicted accurately, at least in a child with a Class I skeletal pattern.
Even in skeletal Class I children, an end-to-end molar relationship is likely to be present during the mixed dentition, and molar shift occurs in these children when the primary molars are lost, so a correction for molar shift is necessary in space analysis. The different pattern of molar shift in children with skeletal Class II or Class III growth patterns is another reason for restricting space analysis to skeletal Class I children (image 2).
 Image 1: Size relationships of primary molars and the premolars that replace them. Image 1: Size relationships of primary molars and the premolars that replace them. |  Image 2: Effect of forward movement of molars in the transition of molar relationships from the mixed to the permanent dentition. Image 2: Effect of forward movement of molars in the transition of molar relationships from the mixed to the permanent dentition. |
Procedures - Steps Involved
Dental Casts for Space Analysis
Let’s go over the steps in carrying out mixed dentition space analysis. A number of materials are required.
First, accurate study casts are required of a patient in the mixed dentition whose maxillary and mandibular permanent first molars, and maxillary and mandibular central and lateral incisors, all have erupted (images 1 and 2).
Occasionally, a space analysis is completed on only the mandibular arch, before it’s possible to do it for the maxillary arch, to begin preliminary planning prior to eruption of the maxillary incisors. If such a preliminary analysis is accomplished, it should be repeated when the maxillary lateral incisors erupt to provide a definitive result.
All study casts should be carefully trimmed to establish correct occlusal relationships. The accuracy of your analysis will depend upon the accuracy of your study casts. These relationships must be checked against the results of the clinical exam.
 Image 1 Image 1 |  Image 2 Image 2 |
Measuring Instrument
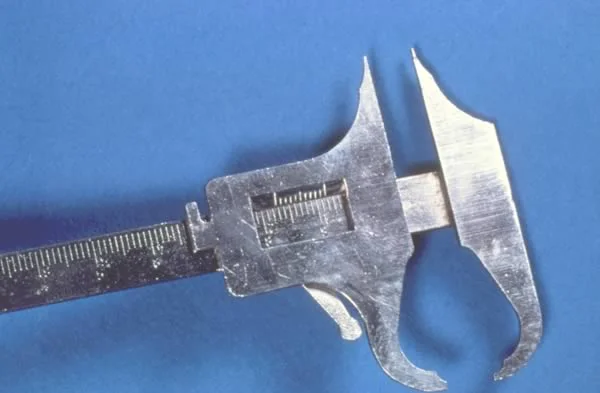
equipment Second, you will need some type of measuring device. Measurements can best be made with a Boley gauge.
The beaks of the Boley gauge should be sharpened, as illustrated here, to permit better access to the interproximal areas. Measurements must be made to the nearest tenth of a millimeter, so accurate instruments are imperative.
Steps in Space Analysis (cont.)
This is the space analysis form you will use. When measurements are made and information is collected, it will be entered on this form.
As a guide to completing the space analysis and its interpretations, we will follow the space analysis form in a section-by-section manner.

Space Analysis Form, Section 1
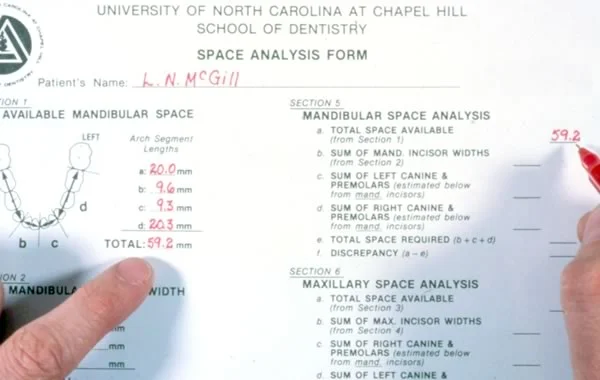
Section 1 on the space analysis form is a determination of the available mandibular arch length. This is calculated by measuring the continuous arch length over the contacts of the mandibular teeth between the mesial of the permanent first molar on the right, and the mesial of the permanent first molar on the left.

Space Analysis Form, Section 1 (cont.)
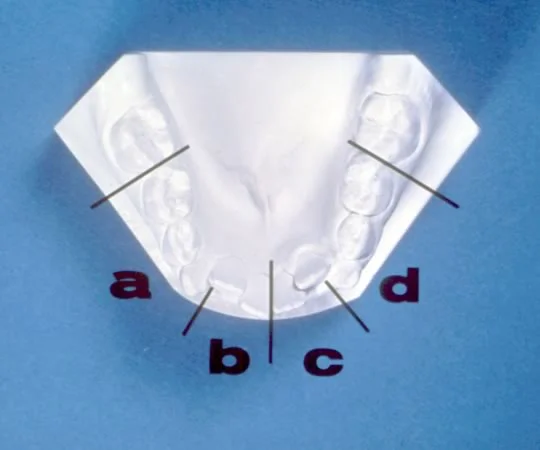
A simple way to accomplish this is to divide the arch into segments in the area of certain teeth. Remember, you’re not measuring teeth. You’re measuring the dimensions of the alveolar process, so the lines separating the segments are marked on the alveolar process, below the teeth.
Segment “a” extends from the mesial of the permanent first molar on the right to the mesial of the primary right canine, not along the facial surface, but approximately over the contacts.
Segment “b” is from the mesial of the primary right canine to the midline, again over the contacts.
Segment “c” is from the midline to the mesial of the primary left canine.
Segment “d” is from the mesial of the primary left canine to the mesial of the permanent left first molar.
Other segments can be measured as long as one is careful not to measure the same space twice.
Space Analysis Form, Section 1 (cont.)
The length of each segment should be measured precisely, using the Boley gauge as shown in these images. Segments A and D, and segments B and C, are measured the same way on each side.
 Image 1: segment A, from a point on the alveolar process below the contact point of the first molar, to a point on the alveolar process approximately below the mesial of the canine Image 1: segment A, from a point on the alveolar process below the contact point of the first molar, to a point on the alveolar process approximately below the mesial of the canine |  Image 2: segment B, from the point in the canine region to the midline Image 2: segment B, from the point in the canine region to the midline |
 Image 3: segment C Image 3: segment C |  Image 4: segment D Image 4: segment D |
Space Analysis Form, Section 1 (cont.)
These measured dimensions are recorded under Section 1 and totaled. The total of the segments is the available mandibular space. Straight-line segments, obviously, are an approximation of the curved space, but the error is small enough to be acceptable.

Space Analysis Form, Section 2
The next step is to complete Section 2, which is measurement of the mesiodistal width of the lower incisors (teeth #23, 24, 25 and 26) (image 1).
The greatest mesiodistal width of each tooth should be measured accurately with a sharp Boley gauge as shown in image 1. This time you are measuring individual teeth.
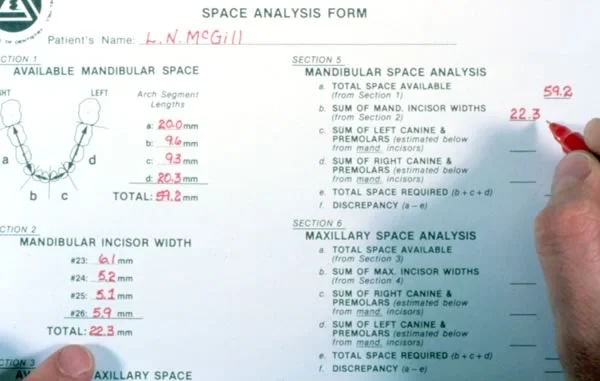
These measurements are then recorded on the form and totaled under Section 2 (image 2).
 Image 1: Measurement of individual mandibular incisor teeth Image 1: Measurement of individual mandibular incisor teeth |  Image 2: Section 2 completed Image 2: Section 2 completed |
Space Analysis Form, Section 3
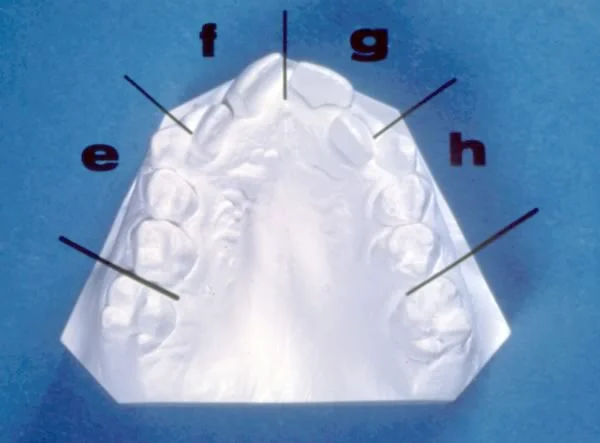
Section 3 calculates the available maxillary arch length. Once again, the measurement is of the continuous arch circumference (from the mesial of the permanent right first molar to the mesial of the permanent left first molar over the existing contacts of the teeth). Dividing the arch into posterior and anterior segments, marking the segment ends on the alveolar ridge, is helpful.
Space Analysis Form, Section 3 (cont).
Segment “e” is marked along the alveolar process from the mesial of the permanent right first molar to the mesial of the primary right canine.
Segment “f” is from the mesial of the primary right canine to the midline.
Segment “g” is from the midline to the mesial of the primary left canine.
Segment “h” is from the mesial of the primary left canine to the mesial of the permanent left first molar.
Space Analysis Form, Section 3 (cont).
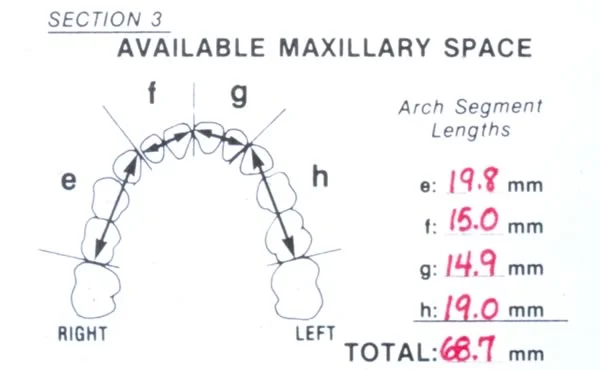
The dimensions for each of the segments are recorded on the form in Section 3 and totaled. This total is the available maxillary space.
Space Analysis Form, Section 4
Section 4 calculates the mesiodistal maxillary incisor width. The maxillary incisors are measured at their greatest width for teeth 7, 8, 9 and 10 (image 1).
After measuring these teeth, the dimensions should be recorded in the appropriate spaces and totaled. This will give the combined maxillary incisor width (image 2).
 Image 1: Each individual maxillary incisor is accurately measured Image 1: Each individual maxillary incisor is accurately measured |  Image 2: Section 4 completed Image 2: Section 4 completed |
Space Analysis Form, Section 5
Section 5 is completion of the mandibular space analysis. The first step (5a) is to transcribe the total mandibular space available from Section 1.
Space Analysis Form, Section 5 (cont.)
The second step (5b) is to transcribe total measured mandibular incisor width from Section 2. This total will also be used in the next step.
Space Analysis Form, Section 5 (cont.)
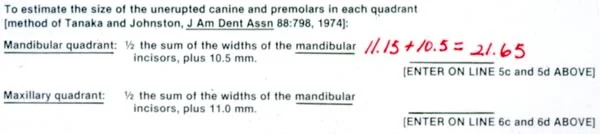
To complete steps 5c and 5d, one must refer to the formula for the mandibular space prediction at the bottom of the form.
The total mandibular incisor width from Section 2 is divided by 2, and 10.5 mm is added to produce a sum that is an estimation of the width of the mandibular unerupted canine and premolars in one mandibular quadrant.
Space Analysis Form, Section 5 (cont.)
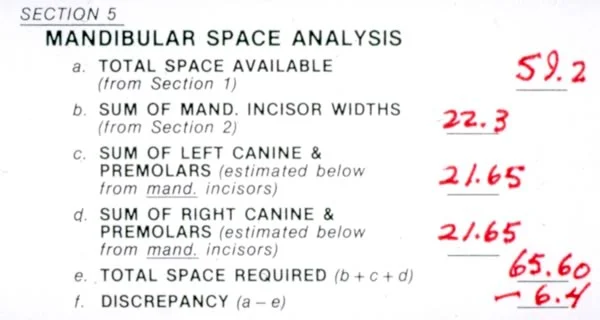
The estimated size of the unerupted mandibular canine and premolars in one quadrant is recorded twice, at lines 5c and 5d for the right and left sides respectively.

Space Analysis Form, Section 5 (cont.)
Lines 5b, 5c and 5d are then added together to give the total space required. This sum is entered on line 5e.

Space Analysis Form, Section 5 (cont.)
Line 5e is then subtracted from 5a to determine the estimate of the space discrepancy for the mandibular arch (5f).
If space required is larger than space available, the discrepancy is recorded as a negative number. If there is more space available than required, the number is positive. In this example the patient has a -6.4mm discrepancy.
Space Analysis Form, Section 6
In Section 6, the maxillary space analysis is completed by first transcribing on to 6a the results of the measurements from Section 3 (total available maxillary space).
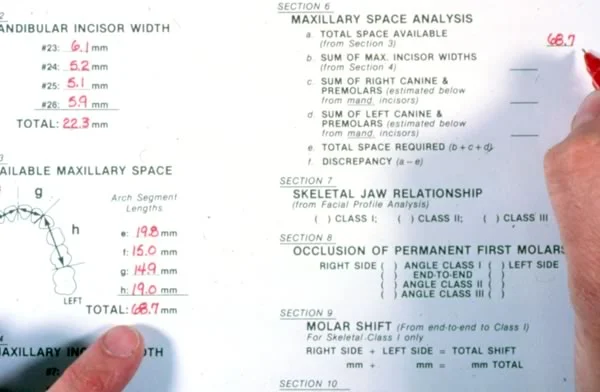
Space Analysis Form, Section 6 (cont.)
Next transcribe to line 6b the total maxillary incisor width derived from Section 4.
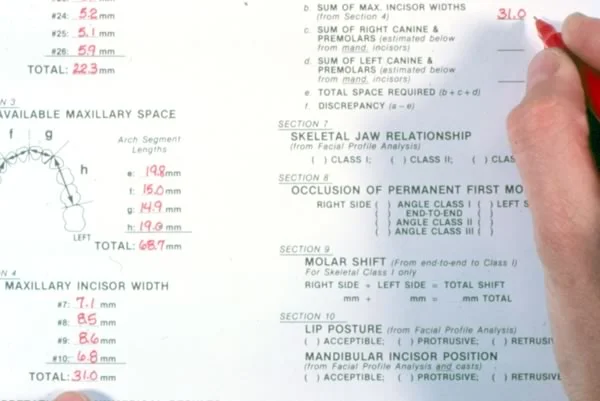
Space Analysis Form, Section 6 (cont.)
Next transcribe to line 6b the total maxillary incisor width derived from Section 4.
Space Analysis Form, Section 7
In order to interpret the numerical results of the space analysis, additional information must be evaluated for each individual patient.
This additional information is compiled in Sections 7-10. First, it is necessary to determine the skeletal status of the patient. This will enable us to project the mandibular incisor stability and its space implications. Remember, the position of the lower incisors is likely to change as a child with a skeletal Class II or Class III malocclusion grows. It also allows us to determine whether the mesial molar shift should be calculated.

Space Analysis Form, Section 7 (cont.)
The information for Section #7 is obtained from the results of the facial profile analysis that is found on the reverse side of the space analysis form.
The facial profile analysis for the patient used in this example revealed a Class I skeletal pattern. If a patient has a Class I skeletal pattern, one would not expect mandibular incisor compensation with growth. Therefore, the space available would remain unchanged.
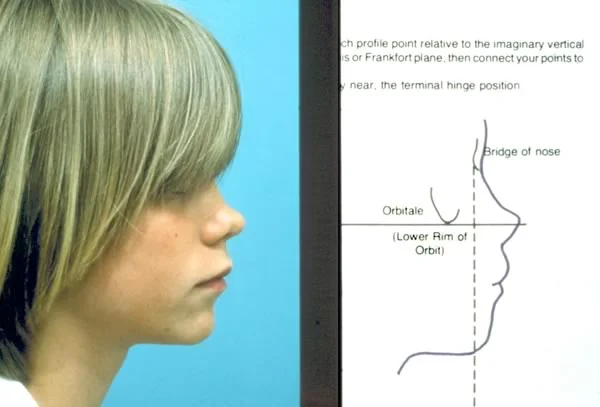
Space Analysis Form, Section 7 (cont.)
The information for Section #7 is obtained from the results of the facial profile analysis that is found on the reverse side of the space analysis form.
The facial profile analysis for the patient used in this example revealed a Class I skeletal pattern. If a patient has a Class I skeletal pattern, one would not expect mandibular incisor compensation with growth. Therefore, the space available would remain unchanged.
Space Analysis Form, Section 7 (cont.)
However, in a Class II skeletal pattern (image 1), it is necessary to realize that the space available may change with growth.
In this mandibular composite tracing of a Class II patient, the original tracing is a solid line and the progress tracing is a dashed line (image 2).
It is evident that the mandibular incisors moved in a facial direction during growth. The lower incisors tend to compensate in a facial direction for the retrusive (Class II) mandible in some Class II patients, and this may actually increase the space available in the mandibular arch.
 Image 1: Class II patient profile and facial form analysis Image 1: Class II patient profile and facial form analysis |  Image 2: Mandibular superimposition for Class II patient: note space changes Image 2: Mandibular superimposition for Class II patient: note space changes |
Space Analysis Form, Section 7 (cont.)
This patient demonstrates a Class III skeletal pattern. In such cases, the mandibular incisor often compensates by tipping lingually (image 1).
In this mandibular composite tracing of a Class III patient, the original tracing is a solid line and the progress tracing is a dashed line (image 2). Note that the lower incisors moved lingually to compensate for the protrusive mandible. When a patient has a Class III skeletal pattern, the space analysis results can be misleading, because the space available is subject to change and may actually be reduced in the mandibular arch. This should be noted in your interpretation.
 Image 1: Class III patient profile and facial form analysis Image 1: Class III patient profile and facial form analysis |  Image 2: Mandibular superimposition for changes in a Class III patient Image 2: Mandibular superimposition for changes in a Class III patient |
Space Analysis Form, Section 8
Section 8 deals with molar relationships.
This image shows the profile analysis and the casts viewed from the right for the Class I example patient. The existing molar relationships should correlate with the skeletal relationships. If they do not, you should be able to explain this inconsistency.
Dental relationships for the right and left sides should be recorded on the form after viewing the articulated casts.
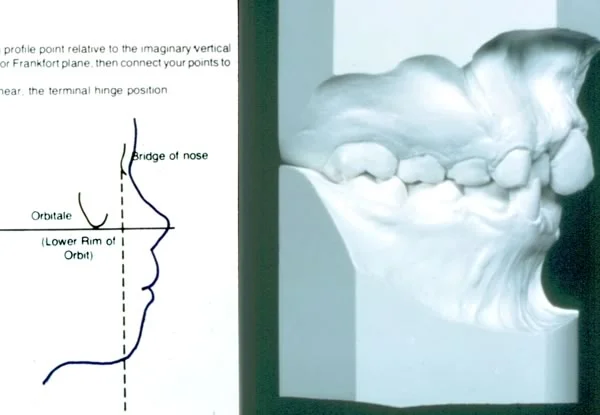
Space Analysis Form, Section 8 (cont.)
If the jaw relationship is Class I and there is a Class II molar relationship, this usually indicates maxillary space loss (image 1). One would suspect a maxillary space shortage, which should be confirmed by the numerical data of the space analysis.
Remember, canine relationships are often a useful clue to the previous dental relationships even when posterior teeth have drifted.
The casts of this patient show a Class II molar relationship and a maxillary space shortage of 5 mm, both of which are due to the patient’s maxillary right first molar moving mesially after premature loss of the 2nd primary molar (image 2).
 Image 1: Class I skeletal patient with a Class II molar relationship Image 1: Class I skeletal patient with a Class II molar relationship |  Image 2: Class II molar relationship on the right side is due to mesial movement of the maxillary right first molar Image 2: Class II molar relationship on the right side is due to mesial movement of the maxillary right first molar |
Steps Section 8
Another possibility is a Class III molar relationship in combination with a Class I skeletal pattern. (Image 1). This often indicates mandibular space loss, which would be confirmed by a space shortage in the lower arch space analysis figures.
These casts illustrate such a patient. The Class III molar relationship and a mandibular space shortage of 5mm are due to the mandibular right first molar moving mesially (image 2).
 Image 1: Class I skeletal patient with a Class III molar relationship Image 1: Class I skeletal patient with a Class III molar relationship |  Image 2: Class III molar relationship on the right side is due to mesial movement of the mandibular right first molar. Note the forward drift of the maxillary left first molar in the same patient Image 2: Class III molar relationship on the right side is due to mesial movement of the mandibular right first molar. Note the forward drift of the maxillary left first molar in the same patient |
Steps Section 8
Another possibility is a Class III molar relationship in combination with a Class I skeletal pattern. (Image 1). This often indicates mandibular space loss, which would be confirmed by a space shortage in the lower arch space analysis figures.
These casts illustrate such a patient. The Class III molar relationship and a mandibular space shortage of 5mm are due to the mandibular right first molar moving mesially (image 2).
| Image 1: Class I skeletal patient with a Class III molar relationship | Image 2: Class III molar relationship on the right side is due to mesial movement of the mandibular right first molar. Note the forward drift of the maxillary left first molar in the same patient |
Steps Section 8 (cont.)
Likewise, if a patient has a Class III skeletal pattern, one would expect a bilateral Class III molar relationship.
Caution must be exercised in interpreting the results in a Class III patient because as growth continues, the lower incisors may move lingually and the upper incisors facially.
Note that this patient is Class III skeletally and dentally. Mixed dentition space analysis probably would underestimate the potential mandibular space discrepancy and severity of mandibular incisor crowding, but might overestimate the situation for the maxillary arch.

Steps Section 8 (cont.)
Even in a skeletal Class I child like our example, the molar relationship may not be Class I. For this patient, the right side is Class I and needs no adjustment for molar shift. But the left side, shown in the lower half of this frame, is end-to-end, and the magnitude of the molar shift needs to be measured.
This is the distance between the two lines marked on the casts. The mesio-buccal cusp of the upper 1st molar should occlude in the buccal groove of the lower first molar. The distance we’re interested in is the discrepancy between those two points.
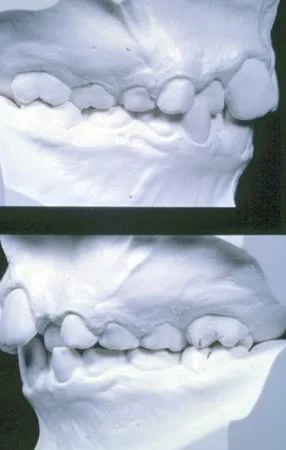
Steps Section 8 (cont.)
Even in a skeletal Class I child like our example, the molar relationship may not be Class I. For this patient, the right side is Class I and needs no adjustment for molar shift. But the left side, shown in the lower half of this frame, is end-to-end, and the magnitude of the molar shift needs to be measured.
This is the distance between the two lines marked on the casts. The mesio-buccal cusp of the upper 1st molar should occlude in the buccal groove of the lower first molar. The distance we’re interested in is the discrepancy between those two points.
Steps Section 8 (cont.)
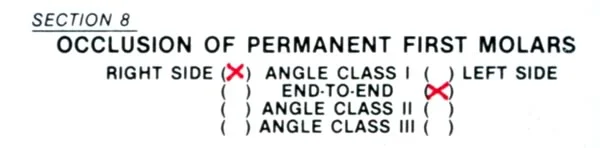
The skeletal Class I patient whose space anlysis we’ve been doing has a Class I molar relationship on the right side and end-to-end on the left side. This has been indicated in Section 8.
Section #9 should be completed ONLY if the patient exhibits a Class I skeletal relationship and one or both molars are in an end-to-end relationship or not quite Class I.
Steps Section 9
With a Class I skeletal relationship and an end-to-end molar relationship, a Class I molar relationship may be achieved during development in one of three ways:
- A shift of the mandibular first permanent molar mesially into the leeway space
- More mandibular than maxillary growth, which will move the mandible forward relative to the maxilla
- A combination of molar shift and growth.
Steps Section 9: Leeway Space
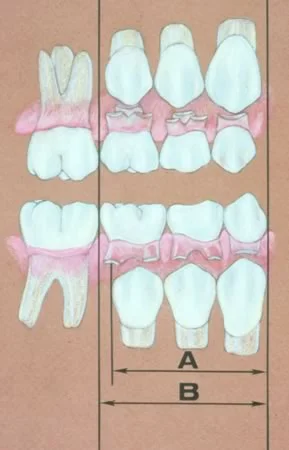
The leeway space is simply the difference in the total widths of the primary molars and canines as compared to the combined width of the permanent teeth which replace them.
In this image, dimension “A” represents the width of the permanent teeth and is somewhat smaller than dimension “B”, which represents the width of the primary teeth.
Steps Section 9: Leeway Space (cont.)
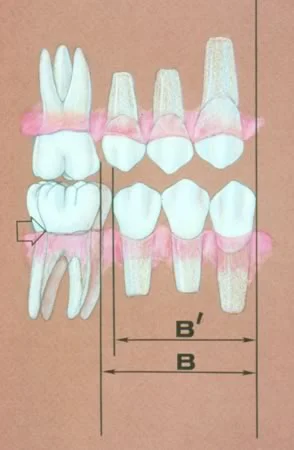
In the late mixed dentition when the primary molars are exfoliated, arch length decreases. As shown here, distance “B” decreases to distance “B prime” when the primary teeth are replaced.
Since this shift is likely to occur when a Class I skeletal relationship and end-to-end molars are present, it is necessary to record the magnitude of this change.
Steps Section 9: Leeway Space (cont.)
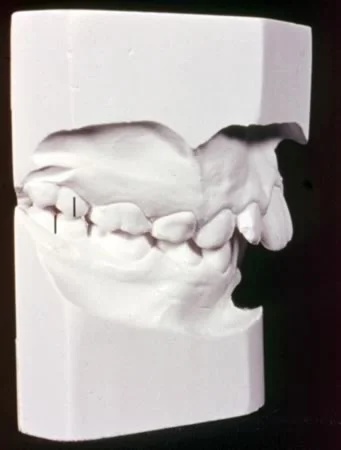
To determine how much shortening of available space will occur due to a mesial shift, draw a vertical line at the mesiobuccal cusp tip of the permanent maxillary first molar and another line in the buccal groove of the permanent mandibular first molar. The distance between these lines with the models in occlusion represents the space required to achieve a Class I occlusion.
The total of this space for right and left sides will not be available for eruption of the permanent premolars and canines.
Steps Section 10
The next section, Section 10, lip posture of the patient, was assessed during the facial profile analysis.
The lip posture should have been recorded as protrusive, normal or retrusive. You made this judgment by looking at the lip prominence relative to the base of the nose and the chin, the nasolabial angle, and lip competence.
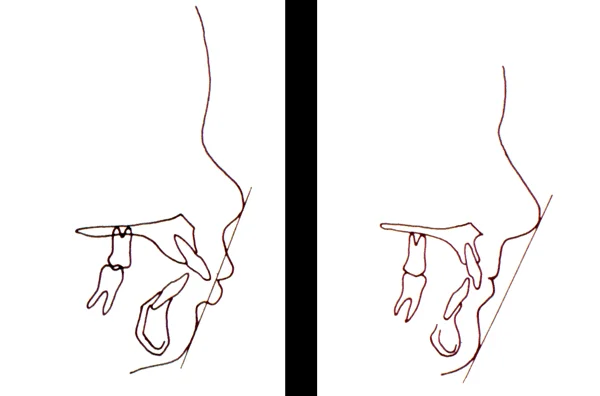
On a sketch of the profile or a cephalometric tracing, it can be helpful to draw the “E line” from the nose to the chin as shown in this image, and examine the position of the lips relative to it. The lips should be about on the line. If they’re well ahead of it, they’re probably protrusive; if they’re behind it, they’re retrusive. But the size of the nose and chin obviously affect this line, which only works if nose and chin are normal.
Steps Section 10 (cont.)
If the lips are over-supported and protrusive, the incisors usually are protrusive.
Conversely, if the lips are under-supported, a retrusive relationship of the incisors can be inferred. In either case, correction of incisor position will generally be desirable, and this correction will definitely influence the amount of space available.
Moving incisors lingually to reduce incisor protrusion also reduces the amount of space available. Conversely, if the incisors are tipped facially to provide more lip support, an increase in space available is realized.
Steps Section 10 (cont.)
This patient illustrates the use of the E-line in judging protrusion. The E line is constructed by connecting the tip of the nose to the most anterior point of the soft tissue pogonion. Normally, the lower lip should lie just behind the line, as this patient.
A change in lower incisor position or lip posture would be inadvisable in this patient. But remember that the E line can be altered by large chins and noses, and you can’t judge protrusion just from it.
Steps Section 10 (cont.)
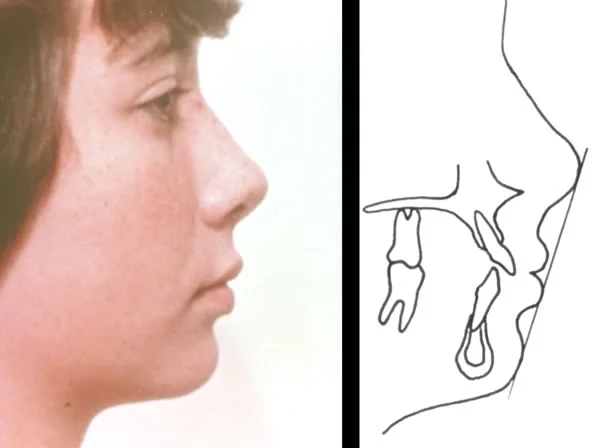
In the patient shown here, the lips are considerably in front of the E-line, which serves to confirm the clinical judgment that the lips and incisors are protrusive.
A reduction of incisor and lip protrusion in this patient, while esthetically desirable, would reduce the available arch length. Since he’s skeletal Class II, there already were concerns about the accuracy of space analysis for him, and the space analysis would not be the major factor in determining his treatment plan.
Remember, the degree of acceptable protrusion is influenced by racial and ethic considerations.
Steps Section 10 (cont.)
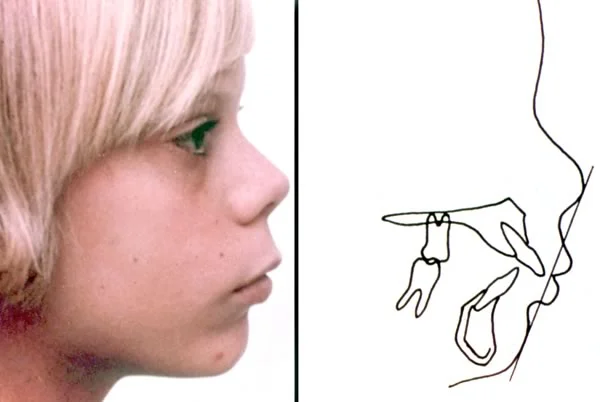
This patient’s upper and lower lips are situated behind the E line, which confirms the clinical judgment that they are retrusive and under-supported by the incisors.
It would be possible to move the maxillary and mandibular incisors facially in this patient if an increase in arch length were necessary.
One must be cautious and realize that there is not always a direct relationship between incisor position and lip posture.
Steps Section 10 (cont.)
This patient’s upper and lower lips are situated behind the E line, which confirms the clinical judgment that they are retrusive and under-supported by the incisors.
It would be possible to move the maxillary and mandibular incisors facially in this patient if an increase in arch length were necessary.
One must be cautious and realize that there is not always a direct relationship between incisor position and lip posture.
Cases
Case Review #1
Now you will be asked to apply some common sense in your observations.
On this screen and the ones following, study the casts shown to determine whether the space analysis result that one of your fellow students calculated is correct, or instead is an over- or under-estimate of the space needed. Assume normal skeletal and soft tissue relationships and no molar shift.
Is this patient really 4 mm short in the lower arch?
![[spaceanalysis_scr68.webp|Case #1, dental casts: Student analysis: -4 mm space discrepancy in the lower arch. Correct?]]
Case Review #1 (cont.)
Because of the minimal irregularity of the incisors and the available leeway space, this is an overestimation of the space needed. If there is a space discrepancy, it is quite small.
![[spaceanalysis_scr68.webp|Case #1, casts: It would take about 2 mm additional space to align the lower incisors, and 2-3 mm space will be available on each side during the transition from primary molars to canines—so the space analysis result of -4 mm almost surely results from an error in calculating either space available or space required.]]
Case Review #2
The space analysis form produced for this patient shows a -1 mm space discrepancy for both arches. Is this patient really only 1 mm short of space?
![[spaceanalysis_scr70.webp|Case #2, casts: The space analysis report is a -1 mm space discrepancy. Correct?]]
Case Review #2 (cont.)
Given the availability of leeway space, this appears to be a good estimation (if the patient is skeletal Class I). Crowding of this extent in the early mixed dentition has the potential to improve during the transition to the full permanent dentition.
![[spaceanalysis_scr70.webp|Case #2, dental casts: It would require about 3 mm space to bring the right lateral incisor into alignment, and perhaps another 2 mm to align the other incisors—but 2-3 mm leeway space on both sides will be available, so a -1 mm discrepancy is a reasonable estimate.]]
Case Review #3
Based on your observation of these casts, is this patient really 3 mm short of space in both arches, as the space analysis form shows?
![[spaceanalysis_scr72.webp|Case #3, dental casts: Space analysis report: -3 mm in both arches. Correct?]]
Case Review #3 (cont.)
For this patient, the space analysis result almost surely underestimates the size of the discrepancy.
You can see on the casts that the mandibular teeth are aligned, but no primary canines are present. In the maxillary arch the permanent lateral incisors have not erupted, and there is almost no space available for them.
This patient is really closer to -7 mm in each arch.
![[spaceanalysis_scr72.webp|Case #3, dental casts: In the mandibular arch, there is very little space for the permanent canines, about 1 mm on one side and 2 mm on the other. The canines are about 7 mm wide, 14 mm for both. So the initial discrepancy would be 11 mm, and even if 4 mm would be gained from leeway space, the discrepancy would be about 7 mm—not the -1 mm reported from the analysis. In the maxillary arch there is little or no room for the lateral incisors, which will be about 6 mm wide, so the math would be the same.]]
Performing a Space Analysis
Now it is time to apply what has been presented in this program. Let’s perform a space analysis for the patient whose casts are shown here (image 1). Notice that there is irregularity in both the maxillary and mandibular arches.
Using the method previously described for measurement and the prediction formula at the bottom of the form, Sections 1 through 6 have been completed (Image 2).
 Image 1: Casts for performance of space analysis Image 1: Casts for performance of space analysis |  Image 2: Partially completed space analysis form. Image 2: Partially completed space analysis form. |
Performing a Space Analysis (cont.)
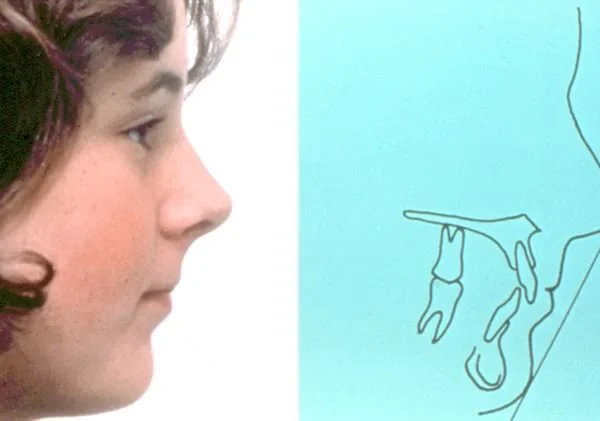
The patient’s face and profile tracing reveal a Class I skeletal relationship (with a mild Class II tendency?), normal vertical relationships, and slightly protrusive lip posture (image 1).
The dental casts reveal an end-to-end relationship on the right and left sides and incisors in both arches that look upright (image 2).
The information obtained from the profile analysis and casts is recorded in Section 7-10 (image 3).
Now, synthesize the information in all sections and write out what you’d put in the final space on the MDA form, the interpretation of the results. Do that before you look at the next screen.
 Image 1, Profile photo and drawing: Profile analysis should tell you whether there is a skeletal jaw discrepancy in the a-p or vertical planes, and whether there is incisor protrusion or retrusion. Image 1, Profile photo and drawing: Profile analysis should tell you whether there is a skeletal jaw discrepancy in the a-p or vertical planes, and whether there is incisor protrusion or retrusion. | 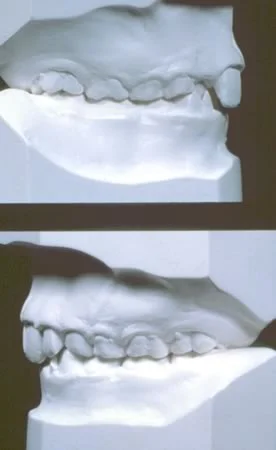 Image 2, Dental casts in occlusion: Note the end-to-end molar occlusion. Image 2, Dental casts in occlusion: Note the end-to-end molar occlusion. |
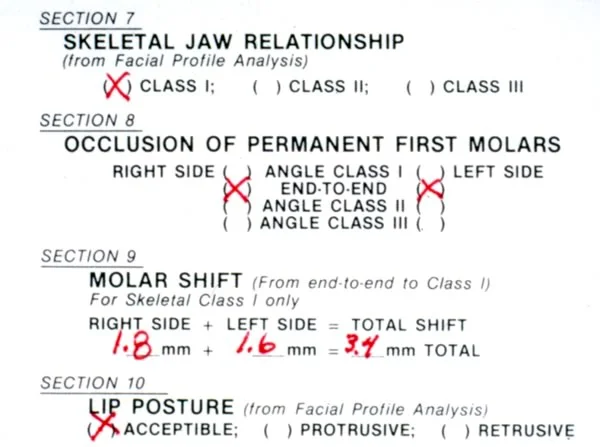 Image 3, Profile and occlusion data added to space analysis form.: Now you have the data on the form—what is your conclusion about space for the permanent teeth for this patient? Image 3, Profile and occlusion data added to space analysis form.: Now you have the data on the form—what is your conclusion about space for the permanent teeth for this patient? |
Interpretation of Space Analysis Result
How does your interpretation compare with the one below?
In this case, there are small maxillary (-0.9mm) and mandibular (-1.6mm) space deficiencies predicted when space required is compared to space available. When this is combined with the molar shift (3.4mm), there appears to be a more significant demand for space in the mandibular arch (1.6mm + 3.4mm). The upright lower incisor position seen in the dental casts suggests that additional arch circumference could be created by proclining the lower incisors. But this patient’s lips appear well related or slightly protrusive, so proclining the lower incisors might make her lips protrusive or incompetent. Her face is not compatible with more than a very little forward movement of the incisors.
An alternate approach, which will be discussed in detail in Level 3, might be to try space management with a lower lingual arch in the late mixed dentition to prevent loss of the leeway space and prevent the molar shift. The lower incisors can be proclined slightly to accommodate the 1.6mm of predicted crowding. The upper molars will then have to be distalized to obtain a Class I molar relationship.
Alternate Technique: Digital Models
With the development of advanced computer technology, digital dental models are becoming more widely used in dental and orthodontic practices. Digital models can be easily manipulated in three dimensions and also eliminate physical storage space requirements (image 1). Note that they are displayed with symmetric bases, so that they look like actual casts that have been trimmed in the standard way. A symmetric base makes it easier to pick up asymmetries in the dental arch.
A virtual space analysis can be preformed on the digital models on a computer screen. Using an on-screen tool, the user measures the individual size of the teeth (image 2) and the circumference of the dental arches. With this information, the computer program can perform different predictions of the size of the unerupted teeth (for instance, Tanaka-Johnston or Moyers) as selected.
Whether the measurements are done on the computer or using a form as we have described, it is important to take everything into account that was considered in the sequence of steps in the space analysis procedure. The computer is just a tool to help you get the information—it can’t be expected to do your thinking for you. Either way, you have to come to a conclusion as to what the space analysis result means and how you would use it in treatment planning.
 Image 1, Virtual dental casts.: These images, scanned from actual casts or from impressions, are quite accurate and can be used for space analysis in the same way as dental casts. Image 1, Virtual dental casts.: These images, scanned from actual casts or from impressions, are quite accurate and can be used for space analysis in the same way as dental casts. |  Image 2, Tooth width measurements: Tooth width is measured for each tooth as shown here, using the cursor. Image 2, Tooth width measurements: Tooth width is measured for each tooth as shown here, using the cursor. |
Referral to Self-Test
To develop skill in space analysis, you will need to do this a number of times—and that’s true whether you do it with actual dental casts or digital models. The self-test for this module is to help you confirm why space analysis is carried out the way it is, and evaluate your understanding of the underlying principles.
Before you take the self-test, be sure you do the assigned reading: pages 427-429 in the 5th edition of Contemporary Orthodontics; pages 195-201 in the 4th edition. Then use the self-test to be sure you have understood the material—and refer to this instructional module when you are assigned child patients who need space analysis as part of their diagnostic evaluation.
Self-Test
Question 1
In doing a space analysis, what is the significance of observing a skeletal Class III relationship?
- incisor position assumption is violated ✓
- tooth size correlation assumption is violated
- molar repositioning assumption is violated
- no significance, it makes no difference to space
Correct
That’s right. In a Class III patient, as in a Class II patient, the incisor position is likely to change, thus changing the space available. Usually the lower incisor moves lingually in a child with a Class III growth pattern, decreasing the available space.
Incorrect
That’s wrong. In a Class III patient, as in a Class II patient, the incisor position is likely to change, thus changing the space available. Usually the lower incisor moves lingually in a child with a Class III growth pattern, decreasing the available space. Tooth size correlations and molar repositioning are not a major component of the problem with these patients.
Question 2
In space analysis, how do you account for the change in first permanent molar position that may occur during the transition to the permanent dentition?
- measure the distance from lower buccal cusp to upper groove
- measure the distance from upper buccal cusp to lower groove ✓
- measure the size difference between upper and lower premolars
- subtract the average mesial movement from space available
Correct
That’s right, the correct procedure is to measure the distance the lower molar would have to move forward to obtain a Class I relationship, which is the distance from upper buccal cusp to lower groove.
Incorrect
That’s wrong. The correct procedure is to measure the distance the lower molar would have to move forward to obtain a Class I relationship, which is the distance from upper buccal cusp to lower groove.
Question 3
Cephalometric analysis shows that in your patient, the lower lip is slightly behind the E line. Your interpretation is
- slight protrusion
- normal lip position ✓
- slight retrusion
- severe retrusion, the lip should be in front of the E line
Correct
That’s right. The lower lip normally is slightly behind the E line, although the E line can be affected by the size of the nose or chin and should not be the sole judge of lip position.
Incorrect
That’s wrong. The lower lip normally is slightly behind the E line, although the E line can be affected by the size of the nose or chin and should not be the sole judge of lip position.
Question 4
Why do prediction tables based on tooth size correlations work better for Caucasian than other population groups?
- Caucasian teeth are more predictable
- upper lateral incisor variation is less in Caucasians
- lower premolars are extremely variable in Orientals
- published tables are based largely on data from Caucasians ✓
Correct
That’s right. There’s no reason to think that the teeth of other racial groups are less predictable, but the size relationships are somewhat different. Ideally, a prediction table would be available for each specific population group, but these specialized tables simply don’t exist.
Incorrect
That’s wrong. The difference in accuracy is because published data are based on Caucasian samples. There’s no reason to think that the teeth of other racial groups are less predictable, but the size relationships are somewhat different. Ideally, a prediction table would be available for each specific population group, but these specialized tables simply don’t exist.
Question 5
In space analysis, why is the prediction formula different for the maxillary and mandibular teeth?
- it isn’t, the same formula works
- different formula required because the correlation coefficients are different for the two arches
- different formula required because the correlations are different for the two arches ✓
- different formula required because the method is different for the upper from the lower arch
Correct
That’s right; the correlations themselves are different even though the method and the correlation coefficients are the same.
Incorrect
That’s wrong. The correlations themselves are different even though the method and the correlation coefficients are the same.
Question 6
During the mixed dentition, which is the preferred method of measuring space available for the permanent teeth?
- measure the width of each tooth individually and sum the numbers
- measure the intercanine and intermolar widths and sum the numbers
- form a wire to the ideal catenary curve and measure its perimeter
- measure the length of arch segments from first molar to first molar ✓
Correct
That’s right, measuring the length of arch segments is preferred. A catenary curve from molar to molar is another possibility but is probably less accurate. Intermolar and intercanine widths cannot provide space available, which is a perimeter measurement. Measuring the teeth individually isn’t possible until they erupt and would give you space required, not space available.
Incorrect
No, that’s wrong. Measuring the length of arch segments is preferred. A catenary curve from molar to molar is another possibility but is probably less accurate. Intermolar and intercanine widths cannot provide space available, which is a perimeter measurement, and measuring the teeth individually isn’t possible until they erupt and would give you space required, not space available.
Question 7
In doing a space analysis, what is the significance of observing a skeletal Class II relationship?
- incisor position assumption is violated ✓
- tooth size correlation assumption is violated
- molar repositioning assumption is violated
- no significance, it makes no difference to space
Correct
That’s right. In a Class II patient, the incisor position is likely to change, thus changing the space available. Usually the lower incisor moves facially in a child with a Class II growth pattern.
Incorrect
That’s wrong. In a Class II patient, the incisor position is likely to change, thus changing the space available. Usually the lower incisor moves facially in a child with a Class II growth pattern.
Question 8
Which of the following is not a frequent cause of error in space analysis?
- inaccurate measurements of space available
- inaccurate measurement of incisor width
- incorrectly trimmed dental casts
- they’re all important causes of error ✓
Correct
That’s right; they’re all important causes of error.
Incorrect
That’s wrong. They’re all important causes of error. Incorrectly trimmed dental casts, so that molar position is shown incorrectly, is one of the more important.
Question 9
Which of the following is not a valid method for calculating the space required for the unerupted permanent teeth?
- radiographic evaluation
- tooth size correlation
- jaw size-tooth size correlation ✓
- radiographic plus tooth size correlation
Correct
That is correct. Jaw size-tooth size correlation is not a valid way to predict how much space is required, but the others are valid methods.
Incorrect
No, that’s wrong. Jaw size-tooth size correlation is not a valid way to predict how much space is required, but the others are valid methods.
Question 10
If your patient has protrusive lips as judged from facial form analysis, how would that affect your interpretation of space analysis results?
- patient has more space than the analysis indicators
- patient has less space than the analysis indicates ✓
- space may increase as incisor becomes more protrusive
- space may increase as molar moves forward less than it would otherwise
Correct
That’s right. In a child with protrusive incisors, space analysis tends to overestimate the amount of space, because some space may be needed to reduce the protrusion.
Incorrect
That’s wrong. In a child with protrusive incisors, space analysis tends to overestimate the amount of space, because some space may be needed to reduce the protrusion. The incisor protrusion is unlikely to change spontaneously, and it doesn’t affect molar shift.
Question 11
Which of the following is not a factor to consider in interpreting the results of space analysis?
- skeletal classification
- dental classification
- incisor position
- dental arch growth ✓
- they all must be considered
Correct
That’s right. A valid assumption of the mixed dentition analysis is that there is no significant growth of the dental arches anterior to the mesial of the first permanent molars, so growth in this area does not have to be considered. Skeletal classification, dental classification and incisor position are all key variables in mixed dentition analysis.
Incorrect
No, that’s wrong. A valid assumption of the mixed dentition analysis is that there is no significant growth of the dental arches anterior to the mesial of the first permanent molars, so growth in this area does not have to be considered. Skeletal classification, dental classification and incisor position are all key variables in mixed dentition analysis.
Question 12
Which of the following is a way that Class I molars are achieved in a child who is skeletally Class I but has flush terminal plane primary molars?
- distal shift of the upper molar
- mesial shift of the lower molar ✓
- differential forward growth of the upper jaw
- restriction of mandibular growth
Correct
That’s right, mesial shift of the lower molar, due to tooth movement and/or differential forward growth of the lower jaw, is the only one of these items that could lead to achievement of Class I molars. Upper molars don’t shift distally during normal development, and both forward growth of the upper jaw and restriction of mandibular growth would make things worse, not better.
Incorrect
No that’s wrong. Mesial shift of the lower molar, due to tooth movement and/or differential forward growth of the lower jaw, is the only one of these items that could lead to achievement of Class I molars. Upper molars don’t shift distally during normal development, and both forward growth of the upper jaw and restriction of mandibular growth would make things worse, not better.
Question 13
(A) The size of the unerupted mandibular canine and premolars can be established better from the size of the maxillary than the mandibular incisors because (B) there is an excellent correlation between the size of the upper incisors and the lower canines/premolars.
- A true, B true, A and B related
- A true, B true, A and B not related
- A true, B false
- A false, B true
- A and B false ✓
Correct
That’s correct, both statements are false. There isn’t a good correlation between the size of upper incisors and other teeth because upper lateral incisors are so variable in size. That’s why the size of both upper and lower canines/premolars can be estimated better from the size of the lower incisors.
Incorrect
That’s wrong. Both statements are false. There isn’t a good correlation between the size of upper incisors and other teeth because upper lateral incisors are so variable in size. That’s why the size of both upper and lower canines/premolars can be estimated better from the size of the lower incisors.
Question 14
(A) During the mixed dentition, space available for the permanent teeth often is less than the space required because (B) the primary incisors are significantly smaller than the permanent incisors that replace them.
- A true, B true, A and B related
- A true, B true, A and B not related ✓
- A true, B false
- A false, B true
- A and B false
Correct
That’s right, both statements are true but they’re not related. Crowding has multiple causes, and the size difference between primary and permanent incisors is not a major one.
Incorrect
That’s wrong. Both statements are true but they’re not related. Crowding has multiple causes, and the size differences between primary and permanent incisors is not a major one.
Question 15
Which of the following is not a key assumption in mixed dentition space analysis?
- There is a high correlation between the size of anterior and posterior teeth.
- Jaw growth occurs primarily in the tooth bearing area of the jaws. ✓
- The patient fits the reference population group.
- The incisors will not move facially or lingually during further growth.
- Repositioning of the molars during the premolar exchange is predictable.
Correct
That’s right, the key assumption is that jaw growth does not occur in the tooth bearing areas of the jaw, so the statement that it does is incorrect.
Incorrect
No, that’s wrong. The key assumption is that jaw growth does not occur in the tooth bearing areas of the jaw, so the statement that it does is incorrect. The other statements are correct as written.
Question 16
What is suggested by a unilateral Class II molar relationship in a child who is skeletal Class I?
- loss of space in the upper arch ✓
- loss of space in the lower arch
- Class III growth pattern with uprighting of the lower incisors
- eruption along a wider perimeter
Correct
That’s right, a Class II molar on one side in a child who is skeletal Class I suggests space loss in the upper arch.
Incorrect
That’s wrong. A Class II molar on one side in a child who is skeletal Class I suggests space loss in the upper arch. The lower molar is in the correct anteroposterior position while the upper molar is further forward due to space loss, hence creating a Class II molar relationship.