Andreasen 1970 - Repositioning Time and Alveolar Fracture Outcomes
Contextual takeaway
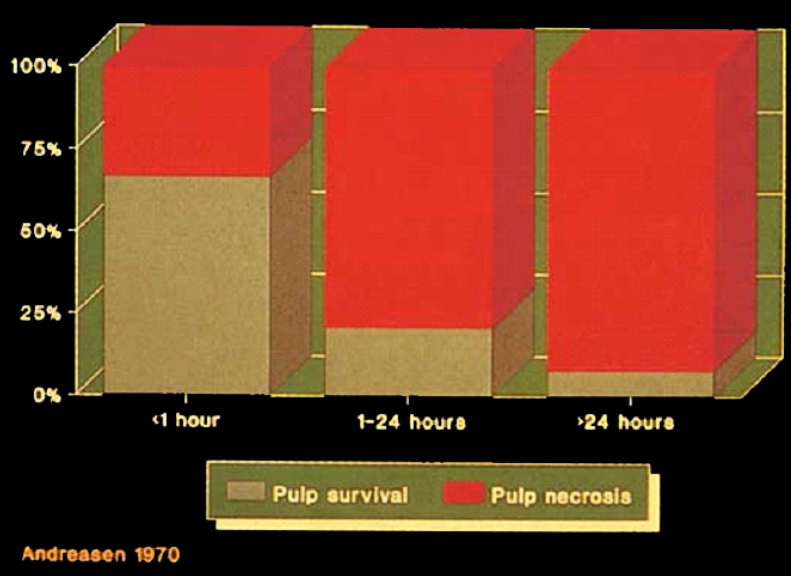
The L14 graph explicitly attributed to Andreasen (1970) shows greater pulp survival in the earlier repositioning categories. The lecture’s retrospective outcome figures describe observed groups; they do not set a rigid-fixation time threshold or predict an individual tooth’s outcome. L14 remains the canonical home for fracture management and lecturer commentary.
Citation and evidence limits
L14 labels the repositioning graph “Andreasen 1970” but supplies no full bibliographic reference, study population, cohort size, or denominator. It describes the alveolar-process outcome figures as retrospective analyses of many teeth, without denominators.
The four alveolar-process percentages appear in the same section as the labeled graph but are not separately cited in the lecture text. The later table under “Teeth Involved in Jaw Fractures” has no explicit source attribution in L14’s text. It is preserved below as adjacent context and is not assigned to Andreasen 1970.
Pulp survival versus time to reposition1
Source: L14 - Pulp Survival vs. Time to Reposition.
The graph uses a 0%-100% y-axis for pulp survival/pulp necrosis and these repositioning intervals on the x-axis: <1 hour, 1-24 hours, and >24 hours.
The L14 commentary states that pulp survival is strongly related to how quickly the tissues and bone are repositioned and stabilized. It says repositioning within one hour gives a much greater chance of pulp survival; when repositioning is delayed up to 24 hours, approximately 20% of pulps may survive; after more than 24 hours, most teeth undergo pulp necrosis.
This is a repositioning-time result. It does not establish a one-hour threshold for rigid fixation.
Original lecture PDF, page 8:
Teeth involved in fractures of the alveolar process2
Source: L14 - Teeth Involved in Fractures of the Alveolar Process.
L14 describes the prognosis as generally good, depending on mechanical and biological factors including root-development stage, pulp involvement, and concurrent injuries. The lecture lists:
| Outcome | Frequency listed in L14 |
|---|---|
| Pulp necrosis | 75% |
| Pulp canal obliteration | 15% |
| Resorption | 11% |
| Loss of marginal bone | 13% |
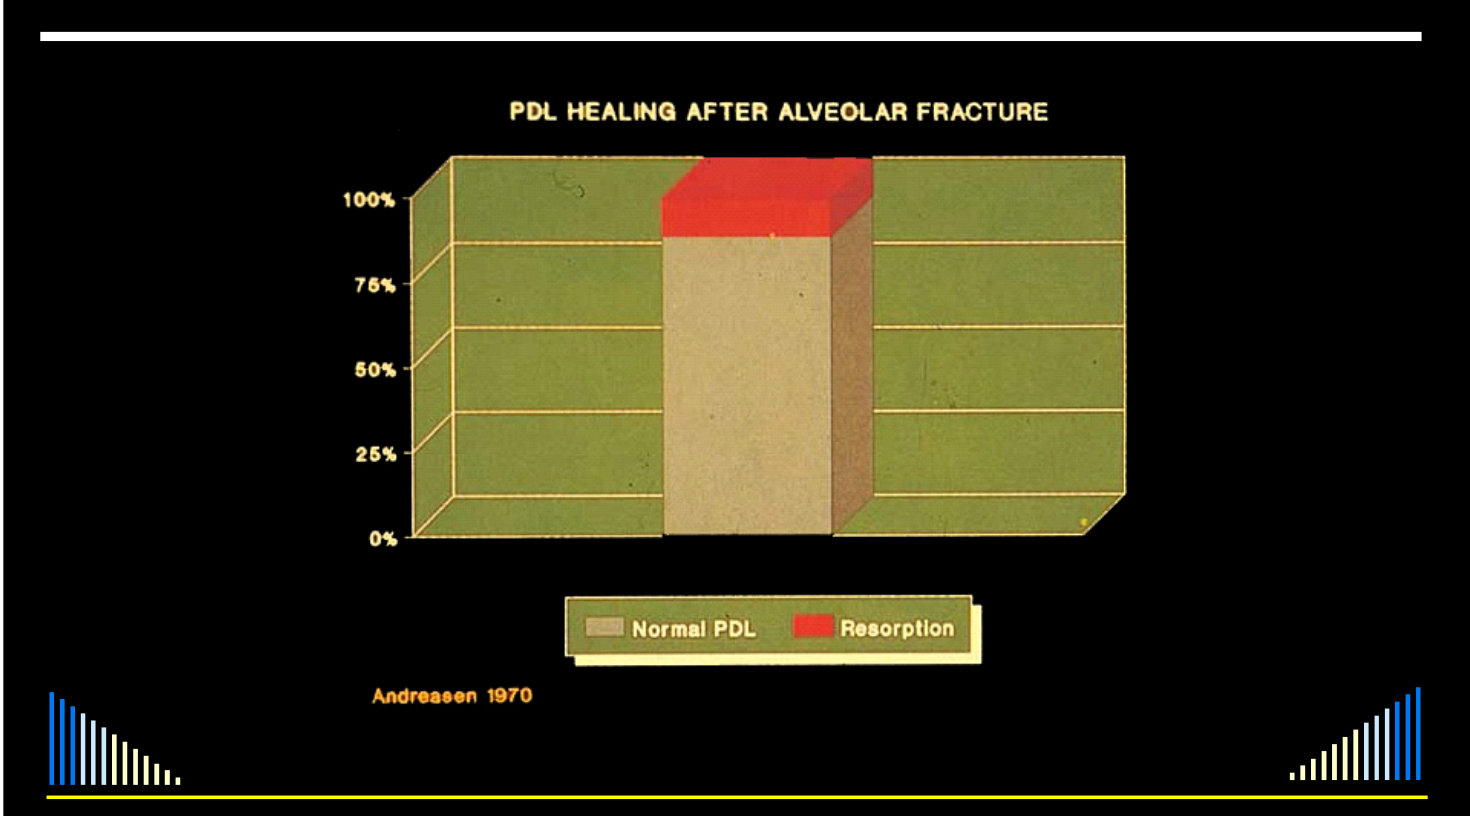
L14 says these figures are a general guide only, based on retrospective analyses of many teeth. It says they should not be used to predict an individual tooth’s outcome and are not probabilities for any one of the listed outcomes or sequelae. The lecture provides no sample size or denominator. The adjacent graph is labeled “Source: Andreasen 1970”; its y-axis is 0%-100% and its x-axis compares Normal PDL and Resorption.
Original lecture PDF, page 9:
Adjacent table: teeth involved in jaw fractures3
Source: L14 - Teeth Involved in Jaw Fractures.
L14 presents a distinct table under this heading:
| Outcome | Frequency listed in L14 |
|---|---|
| Pulp necrosis | 5-25% |
| Pulp canal obliteration | 2-5% |
| Resorption | 1-3% |
| Loss of marginal bone | 12% |
| Infection in the fracture line | 5-29% |
The lecture again calls the figures a general guide only and says they are based on retrospective analyses of many teeth, not individual predictions or probabilities. The source population and denominators are not reported. Because L14 does not explicitly attribute this table to Andreasen 1970, its publication attribution remains unresolved.
Original lecture PDF, page 10:
Footnotes
-
Original L14 PDF page 8: L14 lecture, p. 8; original source heading marker 8. ↩
-
Original L14 PDF page 9: L14 lecture, p. 9; original source heading marker 9. ↩
-
Original L14 PDF page 10: L14 lecture, p. 10; original source heading marker 10. ↩