Andreasen and Ravn 1973 - Primary Tooth Injury and Successor Development
Contextual takeaway
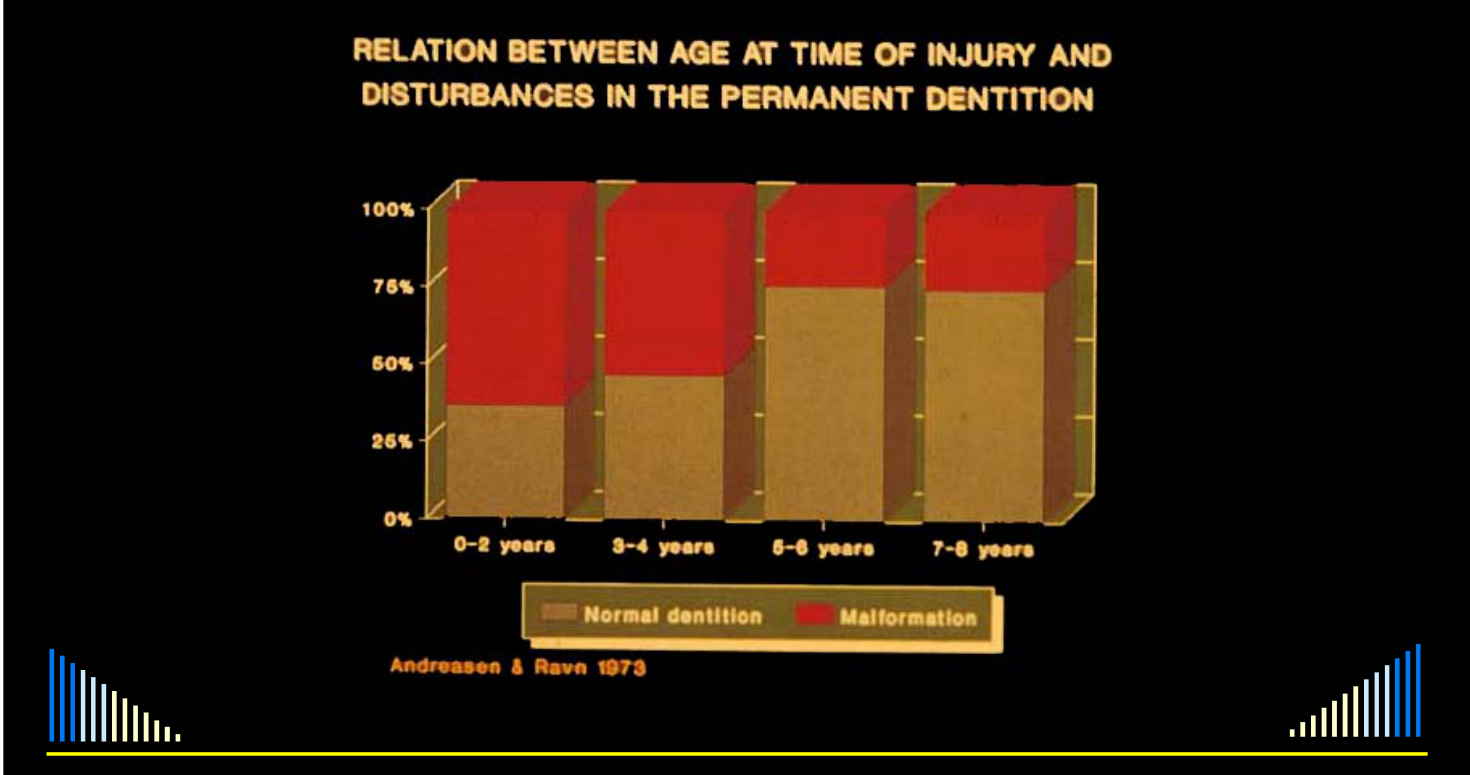
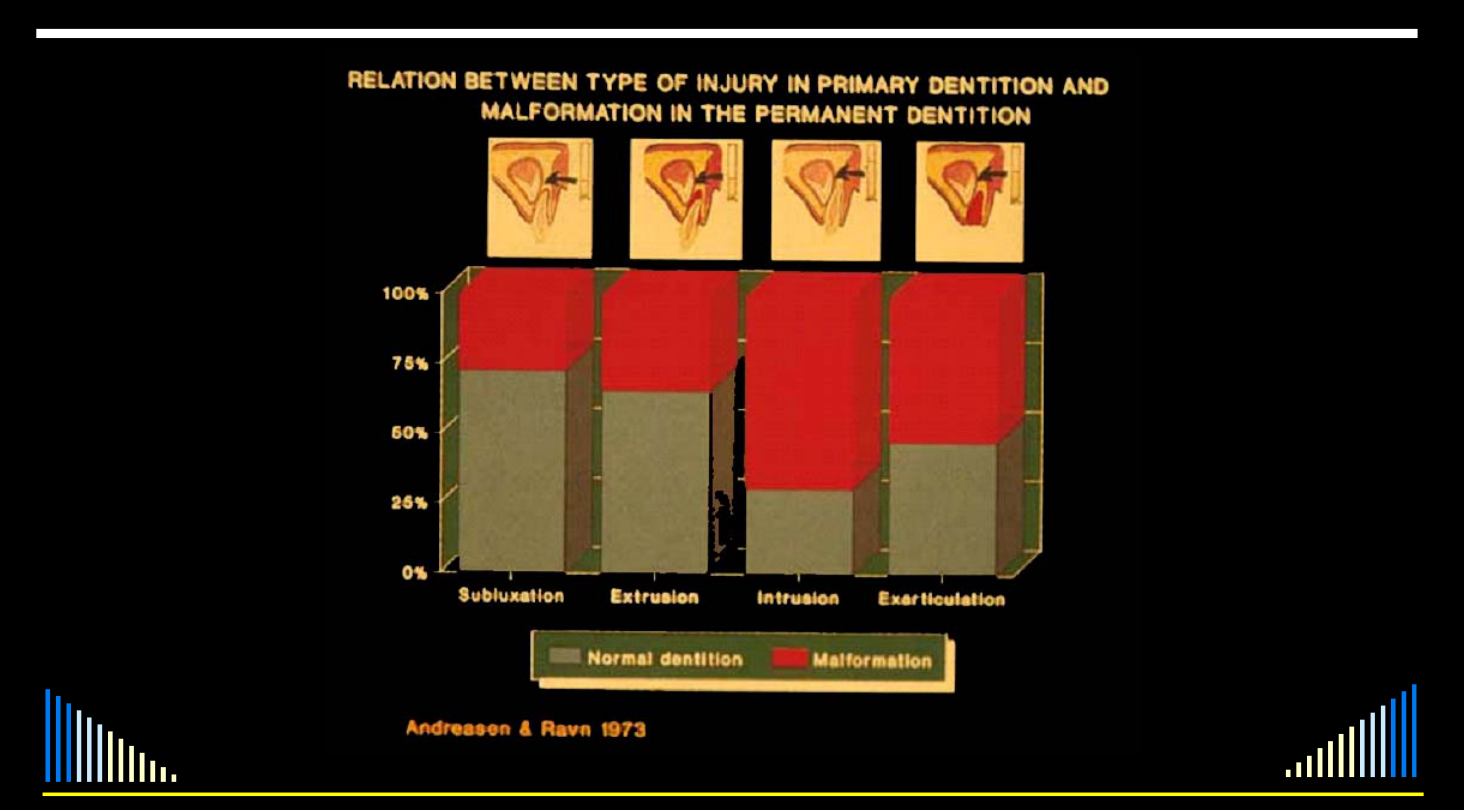
The two L14 charts show “Normal dentition” versus “Malformation” in permanent successors by age at injury and primary-tooth injury type. The visually largest malformation portions occur in the 0–2-year and intrusion strata; these grouped chart proportions do not predict an individual child’s outcome.
Citation and evidence type
L14 credits the age chart to “Andreasen & Ravn 1973.” The injury-chart attribution in the lecture Markdown reads “Andreassen & Ravn 1973,” while its embedded image footer reads “Andreasen & Ravn 1973.” The L14 source contains no complete bibliographic citation, so this partial author-year attribution and spelling difference are retained.
The evidence available in L14 is graphical: outcomes in the permanent dentition stratified by age and type of primary-tooth injury. The lecture does not identify the study design or population.
Evidence extracts
Relation Between Age at Time of Injury and Disturbances in the Permanent Dentition1
Source: L14 - Age at injury and successor disturbance (pre-edit lines 253–272).
Bar chart with y-axis from 0% to 100% (0%, 25%, 50%, 75%, 100%) and x-axis categories: 0–2 years, 3–4 years, 5–6 years, 7–8 years.
Legend: Normal dentition; Malformation.
Figure title: “Relation between age at time of injury and disturbances in the permanent dentition.”
Figure credit in lecture text: “Andreasen & Ravn 1973.”
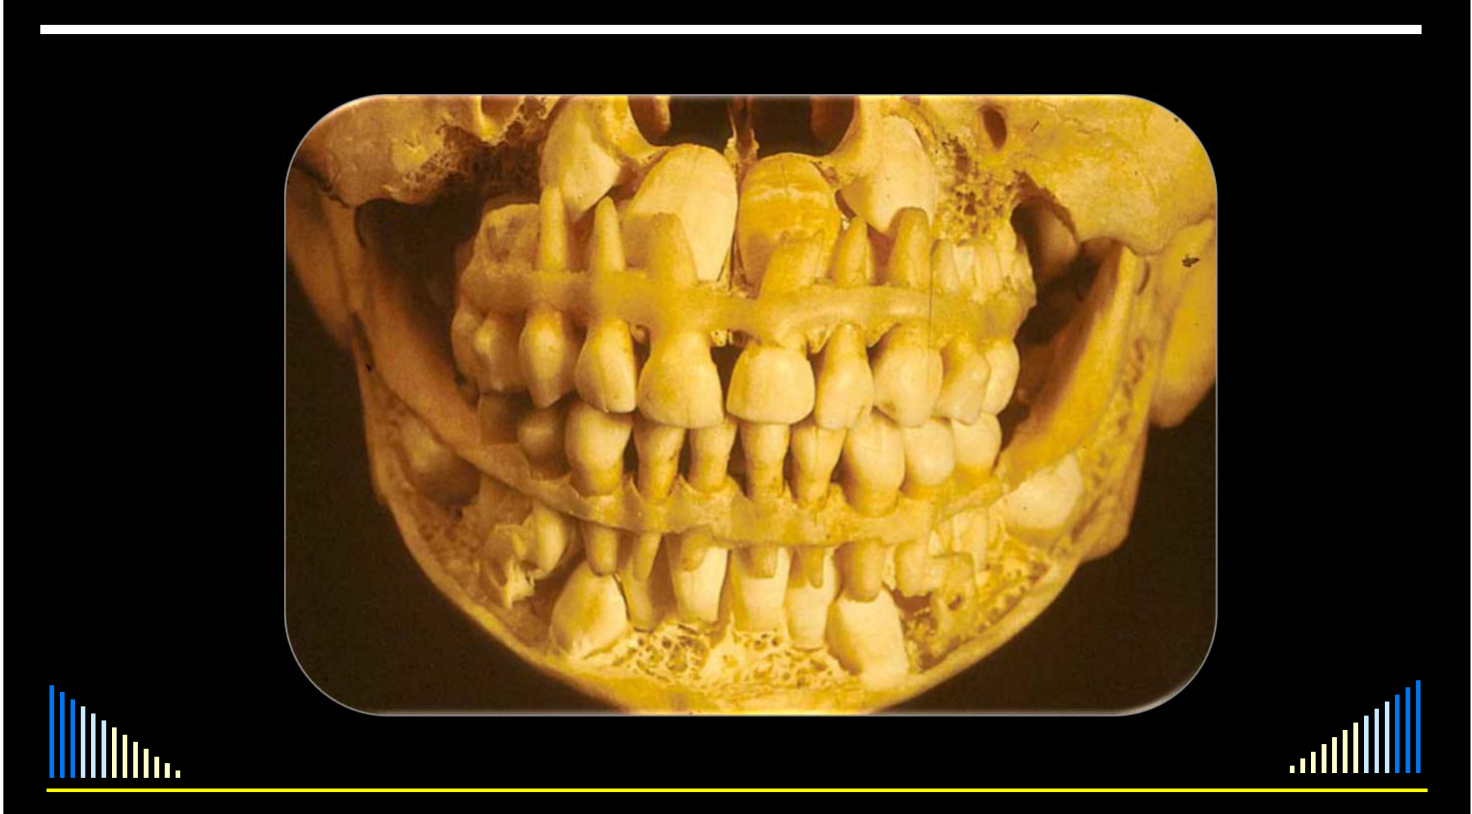
The source slide pairs a jaw image with the age chart:
 |  |
Original lecture PDF, p. 11:
Relation Between Type of Injury in Primary Dentition and Malformation in the Permanent Dentition2
Source: L14 - Injury type and successor malformation (pre-edit lines 274–288).
Bar chart with y-axis from 0% to 100% (0%, 25%, 50%, 75%, 100%) and x-axis categories: Subluxation, Extrusion, Intrusion, Exarticulation.
Legend: Normal dentition; Malformation.
Figure title: “Relation between type of injury in primary dentition and malformation in the permanent dentition.”
Figure credit in lecture Markdown: “Andreassen & Ravn 1973”; the embedded figure footer reads “Andreasen & Ravn 1973.”
Original lecture PDF, p. 12:
Interpretation limits
L14 gives no sample size or denominators, does not label exact segment values, and does not define “Malformation.” Treat these as aggregate chart proportions, not an individualized prognosis.
Footnotes
-
Original PDF page 11: L14 lecture, p. 11 ↩
-
Original PDF page 12: L14 lecture, p. 12 ↩