Burden of Oral Disease Among Priority Population Groups in Australia1
Dr Mohammed Junaid BDS, MDS (Public Health Dentistry), MFDS RCPS (Glasg), DDPH RCS (Eng), AFHEA, PhD Senior Lecturer – Dental Public Health
 |  |
 |  |
Lecturer — Lecture Structure
The lecture was recorded in three parts.
- The first part introduces burden of disease, distinguishes it from incidence and prevalence, and explains disability-adjusted life years as a measurement method.
- The lecture introduces priority population groups identified by the Australian Institute of Health and Welfare and explains why they matter when planning public health activities.
- Subsequent recordings examine oral disease burden and the reasons for that burden among specific priority populations.
Learning Outcomes2
- Understand the concept behind burden of disease.
- Identify the priority population groups in Australia.
- Understand the extent of burden of oral disease among these cohorts.
- Enumerate and appreciate reasons behind the existing burden of disease among these groups of individuals.
Concept and Measurement of Burden of Disease
Concept Behind Burden of Disease3
The term burden of disease generally describes the total, cumulative consequences of a defined disease or a range of harmful diseases with respect to disabilities in a community.
Lecturer — Burden Versus Frequency
Burden of disease is broader than incidence or prevalence: it considers not only how many people have a condition, but also its consequences.
- Incidence refers to the number of new cases, whereas prevalence includes existing cases, both new and previously diagnosed.
- The impact includes effects on daily life, participation and contribution to society, interactions with society, and society more broadly.
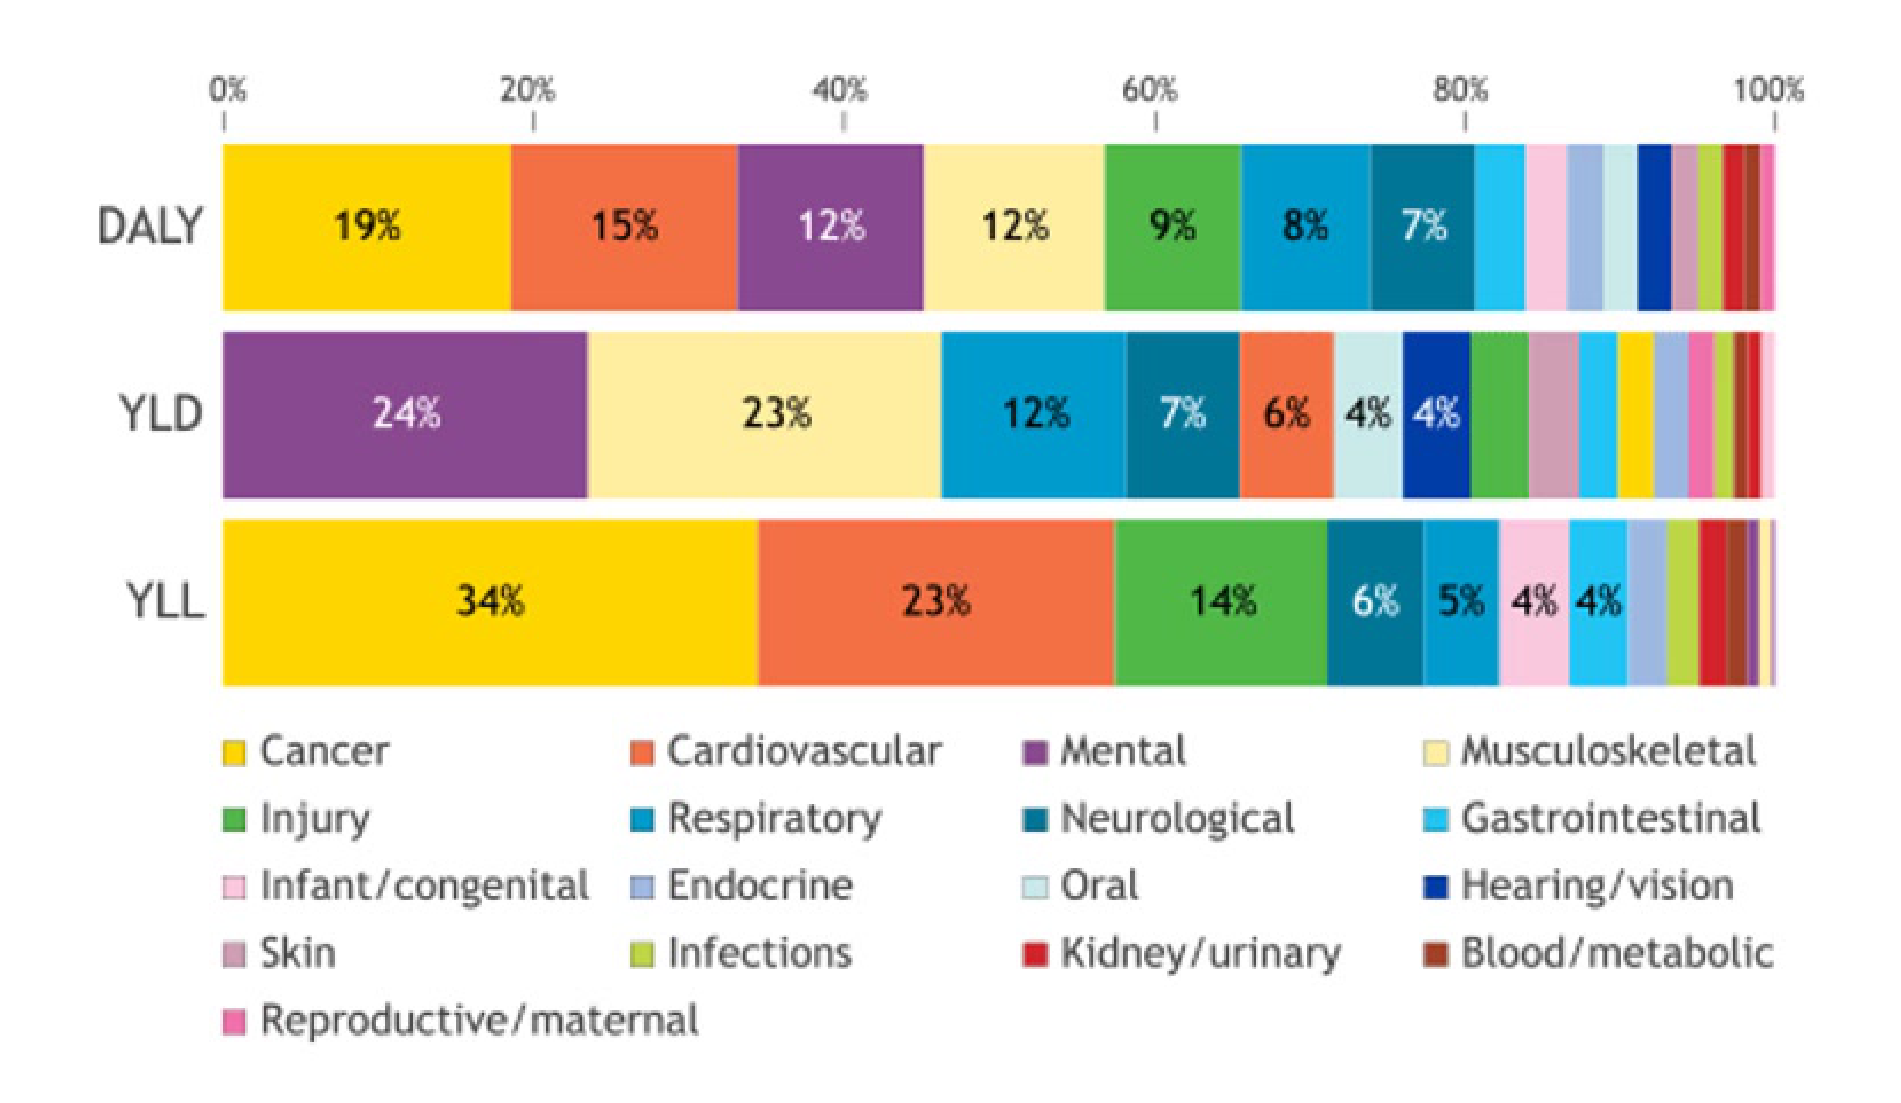
| Category | Cancer | Injury | Infant/congenital | Skin | Reproductive/maternal | Cardiovascular | Respiratory | Endocrine | Infections | Mental | Neurological | Oral | Gastrointestinal | Hearing/vision | Kidney/urinary | Blood/metabolic |
|---|---|---|---|---|---|---|---|---|---|---|---|---|---|---|---|---|
| DALY | 19% | 15% | 12% | 12% | 9% | 8% | 7% | |||||||||
| YLD | 24% | 23% | 12% | 7% | 6% | 4% | ||||||||||
| YLL | 34% | 23% | 14% | 6% | 5% | 4% | 4% |
GBD 2021 Diseases and Injuries Collaborators. Global incidence, prevalence, years lived with disability (YLDs), disability-adjusted life-years (DALYs), and healthy life expectancy (HALE) for 371 diseases and injuries in 204 countries and territories and 811 subnational locations, 1990–2021: a systematic analysis for the Global Burden of Disease Study 2021. Lancet. 2024 May 18;403(10440):2133-2161. doi: 10.1016/S0140-6736(24)00757-8.
Australian Institute of Health and Welfare (2016) Australian Burden of Disease Study: impact and causes of illness and death in Australia 2011, AIHW, Australian Government, accessed 27 July 2024.
Measuring Burden of Disease With Disability Adjusted Life Years4
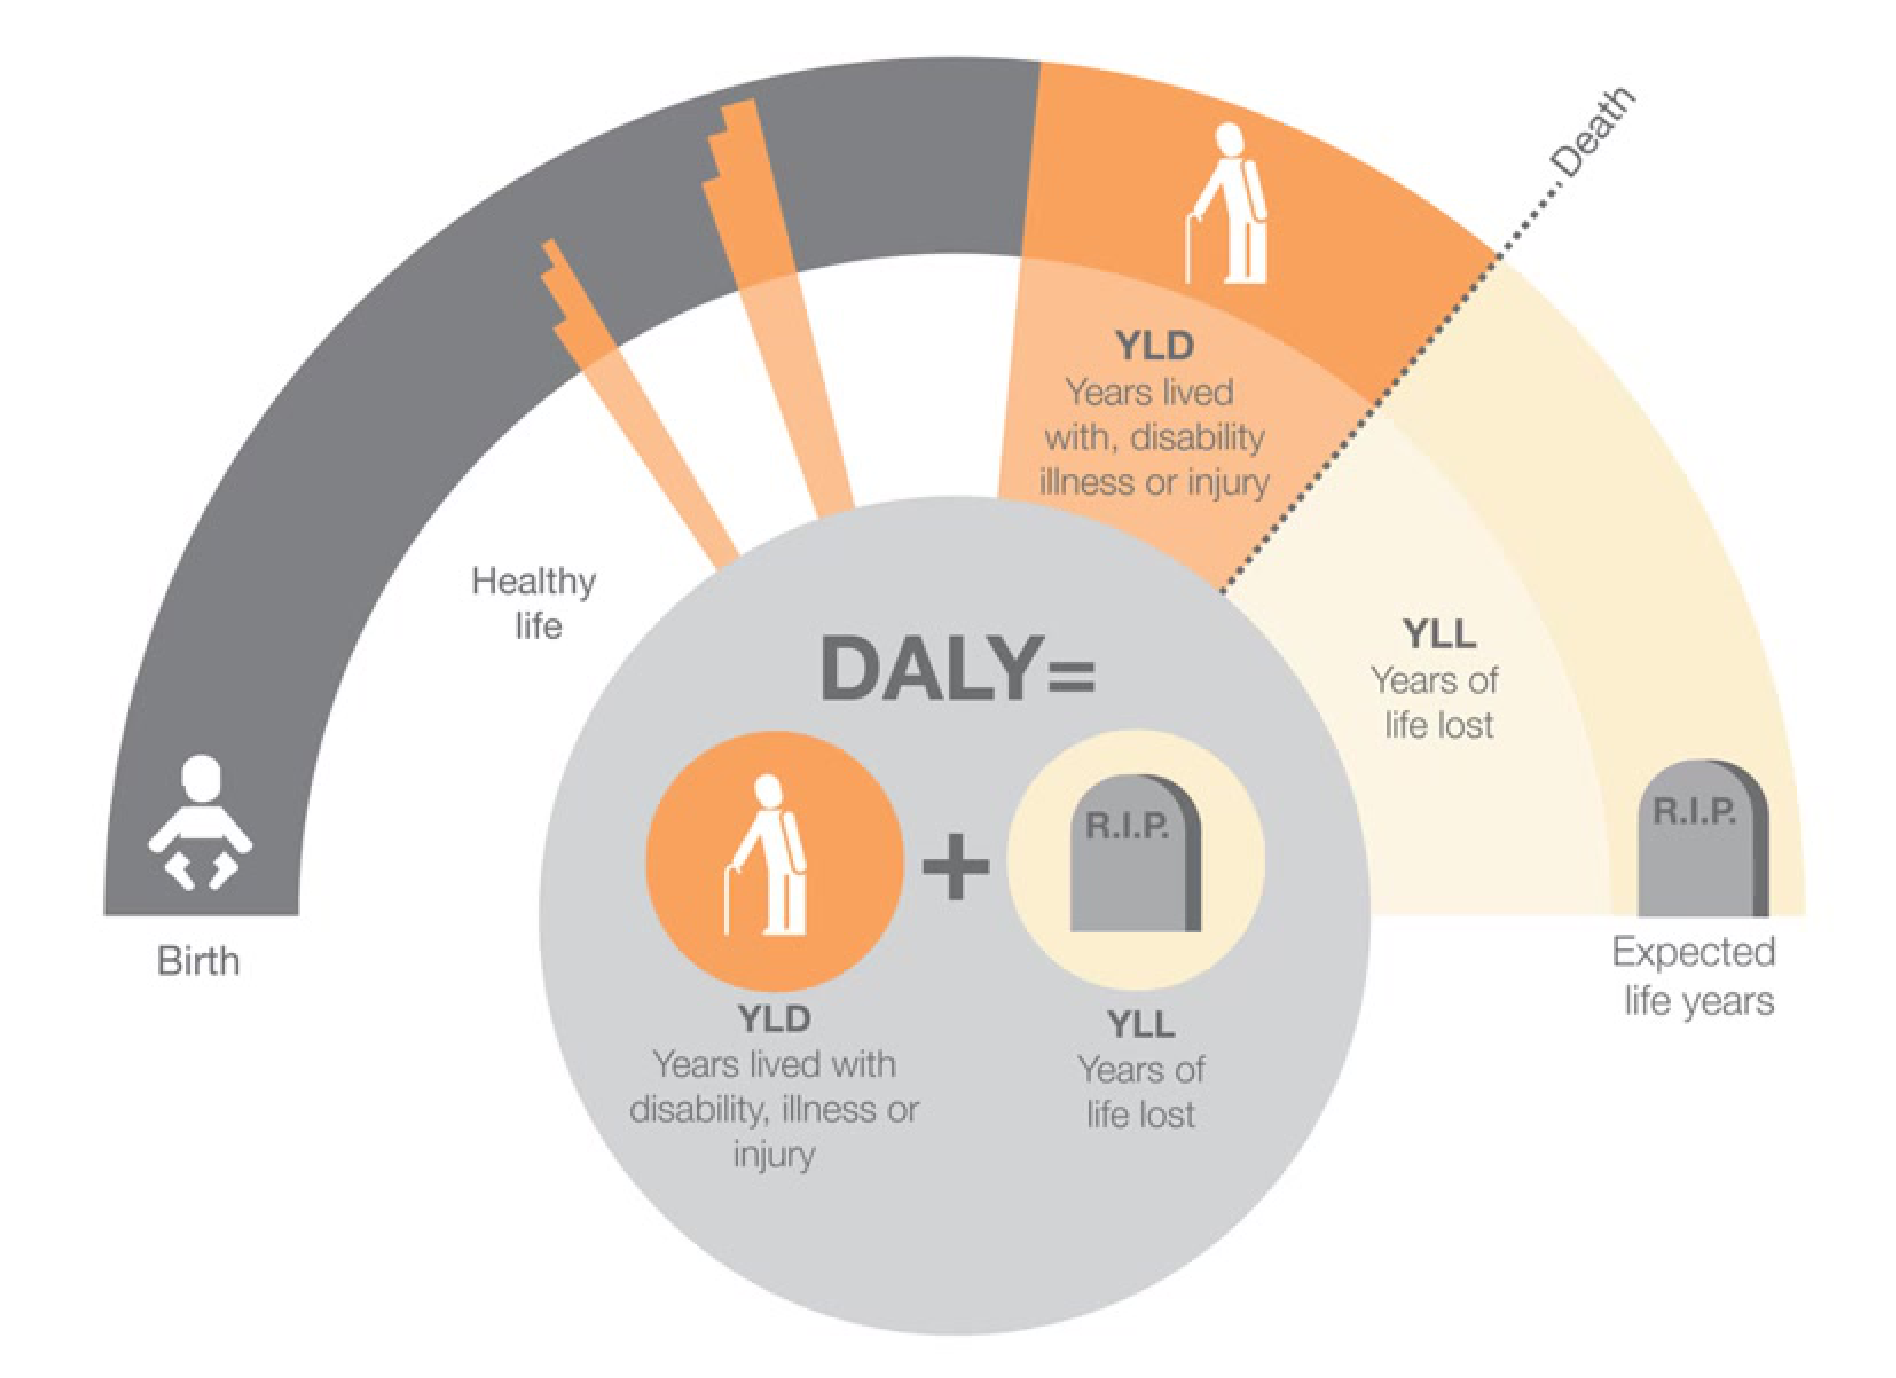
One DALY represents the loss of the equivalent of one year of full health. DALYs for a disease or health condition are the sum of the years of life lost due to premature mortality (YLLs) and the years lived with a disability (YLDs) due to prevalent cases of the disease or health condition in a population.
Oral Cancer and DALYs
If a person is diagnosed with oral cancer at age 55, has a life expectancy of 85 years, and dies at age 65, they have lost approximately 20 years through premature mortality and lived with the disease and its consequences for approximately 10 years. This illustrates the components of a DALY, although the actual calculation is more precise and is performed at a population level.
World Health Organization: https://www.who.int/data/gho/indicator-metadata-registry/imr-details/158
UK Health Security Agency: https://ukhsa.blog.gov.uk/2015/09/15/the-burden-of-disease-and-what-it-means-in-england/
Calculating DALY
Definition of DALY
Disability Adjusted Life Years (DALY) is a measure of overall disease burden, expressed as the cumulative number of years lost due to ill-health, disability, or early death.
- DALYs capture the impact of a condition but do not measure its economic cost to society; economic burden is measured separately.
- YLD = Years Lived with Disability
- YLL = Years of Life Lost
Calculating YLL and YLD
Basic Formula for Calculating YLL
Where:
- = Number of deaths
- = Standard life expectancy at age of death (in years)
Lecturer — YLL Life Expectancy
The relevant life expectancy in the YLL calculation is particularly the geographical life expectancy at death. For example, if a person dies in 2024 and the relevant life expectancy is 84 years, that life expectancy is used in the calculation.
Basic Formula for Calculating YLD
Where:
- = Number of incident cases
- = Disability weight
- = Average duration of disability (in years)
Lecturer — Disability Weights
Disability weights are statistical measures provided by the World Health Organization and range from 0 to 1.
- They represent the impact or “weight” of a disability on overall life.
- They differ according to the condition; a more disabling condition, such as cancer, may have a higher disability weight than dental caries.
- For population calculations, the duration of disability is generally expressed as an average duration.
Public Health Notes: https://www.publichealthnotes.com/daly-disability-adjusted-life-years/
Leading Causes of DALY and YLD Globally5
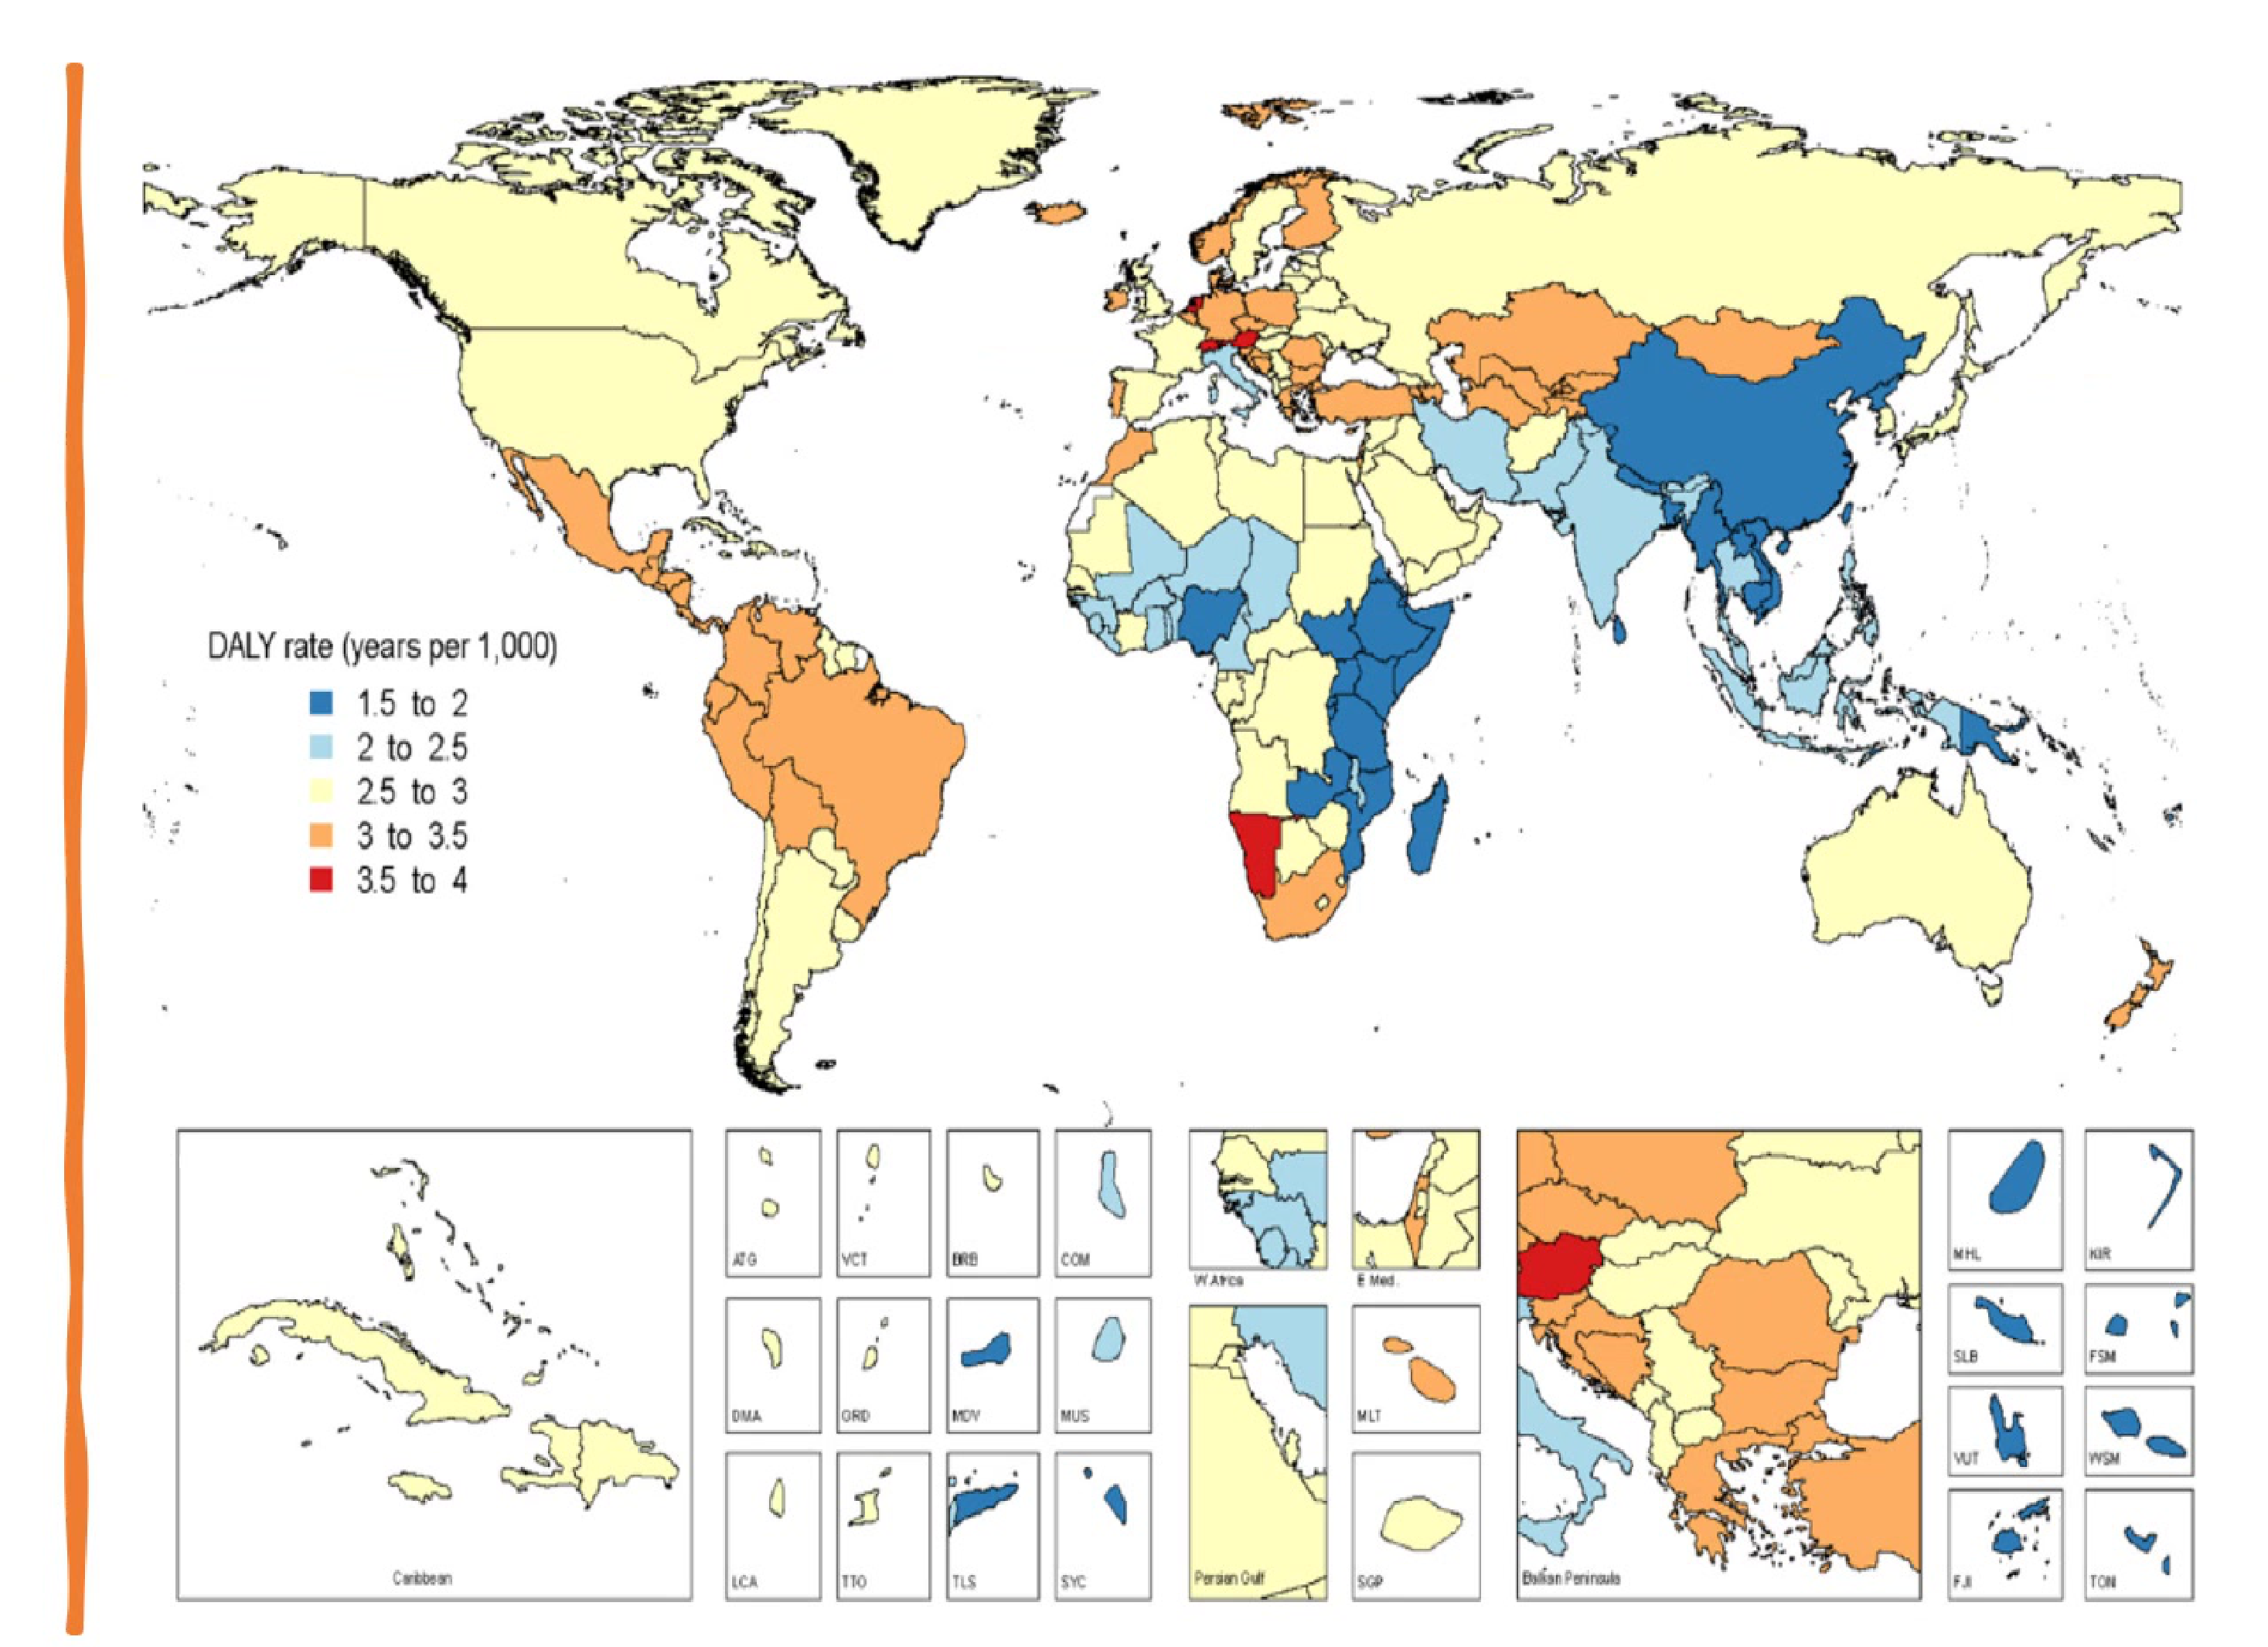
Most Common Causes of Age-Standardised DALY Rates by Location (All Ages, Both Sexes, 2021)
Leading Causes
- COVID-19
- Other COVID-19 pandemic-related outcomes
- HIV/AIDS
- Tuberculosis
- Diarrhoeal diseases
- Malaria
- Neonatal disorders
- Tracheal, bronchus, and lung cancer
- Ischaemic heart disease
- Stroke
- Depressive disorders
- Anxiety disorders
- Drug use disorders
- Diabetes mellitus
- Low back pain
- Road injuries
- Self-harm
- Interpersonal violence
Illustrative Locations
- West Africa
- Eastern Mediterranean
- Northern Europe
GBD 2021 Diseases and Injuries Collaborators. Global incidence, prevalence, years lived with disability (YLDs), disability-adjusted life-years (DALYs), and healthy life expectancy (HALE) for 371 diseases and injuries in 204 countries and territories and 811 subnational locations, 1990-2021: a systematic analysis for the Global Burden of Disease Study 2021. Lancet. 2024 May 18;403(10440):2133-2161. doi: 10.1016/S0140-6736(24)00757-8.
Top 25 Leading Level 3 Causes of Global YLDs (2021)
Top 25 leading Level 3 causes of global YLDs across all ages, for both sexes combined, including counts, age-standardised rates, and percentage change between 2010 and 2021:
| Cause | Percentage of all-cause YLDs | Count (millions) | Age-standardised rate (per 100 000) | Percentage change, 2010–21 YLD count | Percentage change, 2010–21 Age-standardised rate |
|---|---|---|---|---|---|
| 1. Low back pain | 7.7% (6.5 to 9.1) | 70.2 (50.2 to 94.1) | 832.2 (595.9 to 1115.3) | 19.4% (17.9 to 20.8) | -2.4% (-2.9 to -1.8) |
| 2. Depressive disorders | 6.2% (5.0 to 7.8) | 56.3 (39.3 to 76.5) | 681.2 (475.3 to 924.0) | 36.5% (31.7 to 41.7) | 16.4% (11.9 to 21.3) |
| 3. Headache disorders | 5.2% (1.2 to 10.4) | 48.0 (9.80 to 101) | 588.4 (117.6 to 1245.7) | 14.4% (12.7 to 17.8) | 0.3% (-1.1 to 1.4) |
| 4. Age-related and other hearing loss | 4.9% (3.9 to 5.9) | 44.4 (30.7 to 62.0) | 525.9 (364.2 to 731.9) | 31.6% (30.0 to 33.1) | 2.5% (1.7 to 3.3) |
| 5. Other musculoskeletal disorders | 4.8% (3.6 to 6.2) | 43.0 (29.6 to 59.2) | 507.2 (349.5 to 698.0) | 28.7% (26.7 to 30.8) | 6.3% (5.6 to 7.0) |
| 6. Anxiety disorders | 4.7% (3.6 to 6.0) | 42.5 (29.4 to 57.7) | 524.3 (363.3 to 716.2) | 33.7% (30.7 to 37.0) | 16.7% (14.0 to 19.8) |
| 7. Diabetes mellitus | 4.5% (3.9 to 5.2) | 41.2 (29.0 to 56.5) | 477.0 (336.1 to 653.3) | 62.9% (60.3 to 65.8) | 25.9% (24.0 to 28.1) |
| 8. Dietary iron deficiency | 3.6% (2.8 to 4.2) | 32.3 (21.8 to 46.5) | 423.7 (285.3 to 611.0) | 3.2% (0.9 to 5.2) | -7.3% (-9.4 to -5.5) |
| 9. Blindness and vision loss | 3.2% (2.4 to 4.4) | 29.2 (19.0 to 42.9) | 342.8 (224.2 to 503.6) | 32.9% (27.4 to 38.6) | 2.6% (-2.5 to 7.7) |
| 10. Gynaecological diseases | 3.0% (2.5 to 3.7) | 27.4 (19.1 to 38.2) | 334.0 (232.7 to 467.5) | 15.3% (14.0 to 16.8) | 1.4% (0.6 to 2.3) |
| 11. Falls | 2.7% (2.3 to 3.0) | 24.2 (16.8 to 32.8) | 288.6 (200.9 to 391.7) | 21.4% (19.2 to 23.3) | -3.5% (-4.7 to -2.6) |
| 12. Oral disorders | 2.6% (1.7 to 3.6) | 23.2 (13.8 to 35.0) | 275.9 (164.2 to 416.8) | 25.1% (21.4 to 28.6) | 0.4% (-2.6 to 3.3) |
| 13. Neonatal disorders | 2.4% (2.0 to 2.8) | 21.7 (15.7 to 27.3) | 282.7 (204.9 to 356.1) | 24.9% (13.8 to 35.3) | 13.5% (3.6 to 22.9) |
| 14. Osteoarthritis | 2.3% (1.4 to 4.5) | 21.3 (10.2 to 42.9) | 244.5 (117.1 to 493.1) | 36.9% (35.2 to 38.5) | 2.4% (1.3 to 3.5) |
| 15. Neck pain | 2.2% (1.7 to 2.9) | 20.4 (13.6 to 28.9) | 242.3 (162.6 to 342.8) | 22.0% (19.4 to 24.6) | 1.4% (1.0 to 1.9) |
| 16. Stroke | 1.7% (1.3 to 2.0) | 15.2 (11.0 to 19.4) | 178.7 (128.9 to 227.6) | 29.1% (25.4 to 32.8) | -1.2% (-4.0 to 1.5) |
| 17. COPD | 1.7% (1.3 to 2.1) | 14.9 (12.4 to 17.1) | 174.4 (145.5 to 201.0) | 29.1% (24.8 to 33.3) | -2.5% (-5.7 to 0.5) |
| 18. Schizophrenia | 1.7% (1.2 to 2.2) | 14.8 (10.9 to 19.1) | 177.8 (131.6 to 228.9) | 16.3% (14.9 to 17.8) | 0.0% (-0.9 to 0.9) |
| 19. COVID-19 | 1.6% (0.6 to 3.6) | 14.3 (5.14 to 33.7) | 176.4 (63.1 to 418.9) | — | — |
| 20. Alzheimer’s disease and other dementias | 1.3% (1.0 to 1.6) | 11.6 (7.96 to 15.3) | 141.9 (97.7 to 187.2) | 45.7% (44.1 to 47.2) | 2.6% (1.7 to 3.5) |
| 21. Autism spectrum disorders | 1.3% (0.8 to 2.0) | 11.5 (7.84 to 16.3) | 147.6 (100.2 to 208.1) | 12.9% (11.9 to 13.7) | 0.7% (-0.2 to 1.4) |
| 22. Alcohol use disorders | 1.2% (1.0 to 1.5) | 11.0 (7.68 to 15.3) | 132.3 (92.3 to 184.5) | 6.8% (3.4 to 10.5) | -8.1% (-10.8 to -5.4) |
| 23. Asthma | 1.1% (0.9 to 1.4) | 10.2 (6.50 to 15.0) | 131.1 (84.0 to 194.7) | 2.1% (0.2 to 4.4) | -11.1% (-12.8 to -8.9) |
| 24. Drug use disorders | 1.0% (0.8 to 1.3) | 9.23 (6.54 to 11.8) | 114.1 (80.9 to 145.5) | 26.2% (22.5 to 30.1) | 13.9% (10.9 to 17.2) |
| 25. Other mental disorders | 1.0% (0.7 to 1.3) | 8.96 (5.72 to 13.5) | 106.6 (68.2 to 160.7) | 19.5% (18.4 to 21.0) | -0.2% (-0.8 to 0.2) |
Note: Data in parentheses are 95% uncertainty intervals. Count data are presented to three significant figures, and rates and percentage change data are presented to one decimal place. COPD = chronic obstructive pulmonary disease. YLDs = years lived with disability.
GBD 2021 Disaactivity and Mortality Collaborators. Global incidence, prevalence, years lived with disability (YLDs), disability-adjusted life-years (DALYs), and healthy life expectancy (HALE) for 371 diseases and injuries in 204 countries and territories and 217 subnational locations: 1990-2021: a systematic analysis for the Global Burden of Disease Study 2021. Lancet. 2024 May 18;403(10440):2133-2161. doi:10.1016/S0140-6736(24)00578-6.
Australian Burden of Disease (2023)
Leading Causes of Years Lived with Disability (YLD)
| Rank in 2023 | Leading disease in 2023 | % change since 2003 |
|---|---|---|
| 1 [Yellow] | Back pain and problems | 8.4 |
| 2 [Blue] | Anxiety disorders | 33.2 |
| 3 [Grey] | Depressive disorders | 11.4 |
| 4 [Green] | Asthma | 10.4 |
| 5 [Yellow] | Osteoarthritis | 27.3 |
| 6 [Purple] | Autism spectrum disorders | 260.8 |
| 7 [Yellow] | Rheumatoid arthritis | -35.4 |
| 8 [Green] | COPD | -7.5 |
| 9 [Blue] | Hearing loss | 14.1 |
| 10 [Grey] | Dementia | -0.5 |
| 11 [Blue] | Type 2 diabetes mellitus | 24.5 |
| 12 [Grey] | Bipolar affective disorder | 33.1 |
| 13 [Purple] | Eating disorders | 20.6 |
| 14 [Grey] | Alcohol use disorders | -21.7 |
| 15 [Grey] | Dental caries | 16.3 |
Leading Causes of Disability-Adjusted Life Years (DALY)
| Rank in 2023 | Leading disease in 2023 | % change since 2003 |
|---|---|---|
| 1 [Orange] | Coronary heart disease | -58.2 |
| 2 [Yellow] | Back pain and problems | 8.3 |
| 3 [Purple] | Anxiety disorders | 33.2 |
| 4 [Purple] | Depressive disorders | 11.2 |
| 5 [Green] | Dementia | 39.8 |
| 6 [Green] | Suicide and self-inflicted injuries | 16.6 |
| 7 [Blue] | COPD | -12.9 |
| 8 [Blue] | Asthma | 8.4 |
| 9 [Yellow] | Lung cancer | -31.4 |
| 10 [Grey] | Osteoarthritis | 26.7 |
Australian Institute of Health and Welfare (2023) Australian Burden of Disease Study 2023, AIHW, Australian Government, accessed 28 July 2024. https://www.aihw.gov.au/reports/burden-of-disease/australian-burden-of-disease-study-2023/contents/interactive-data-on-disease-burden/leading-causes-of-disease-burden
- Disease Statistics
- Side and Side statistics
- Prevalence
Global prevalence of dental caries in children ages 0–1 years worldwide: 10%–49%
Global Burden of Disease Report 2016, World Health Organization.
Global Burden of Oral Conditions6
How do we report global burden of oral disease?:
a. Deciduous tooth caries (focus on untreated)
b. Permanent tooth caries (focus on untreated)
 c. Periodontal disease
 d. Tooth loss
 e. Other oral disorders (not lip and oral cavity cancer)
 f. Lip and oal cavity cancer (covered under neoplasms)
 g. Cleft lip and palata (covered nder congenital conditions)
Burden of Oral Disease in Australia – Recent Findings7
Source: Australian Institute of Health and Welfare (2023) Australian Burden of Disease Study 2023, AIHW, Australian Government, accessed 28 July 2024. https://www.aihw.gov.au/reports/burden-of-disease/australian-burden-of-disease-study-2023/contents/interactive-data-on-disease-burden/comparisons-over-time
All Oral Disorders
Study Parameters8
- Measure: DALY
- Sex view: Persons
- Period: 2003–2023
- Disease group: Oral disorders
- Disease/Injury: All causes
Lecturer — All Oral Disorders
The Australian findings discussed were from the Australian Burden of Disease Study 2023.
- The all-oral-disorders category excludes lip and oral cavity cancer and cleft lip and palate.
- It includes deciduous and permanent tooth caries, periodontal disease, tooth loss and other oral disorders.
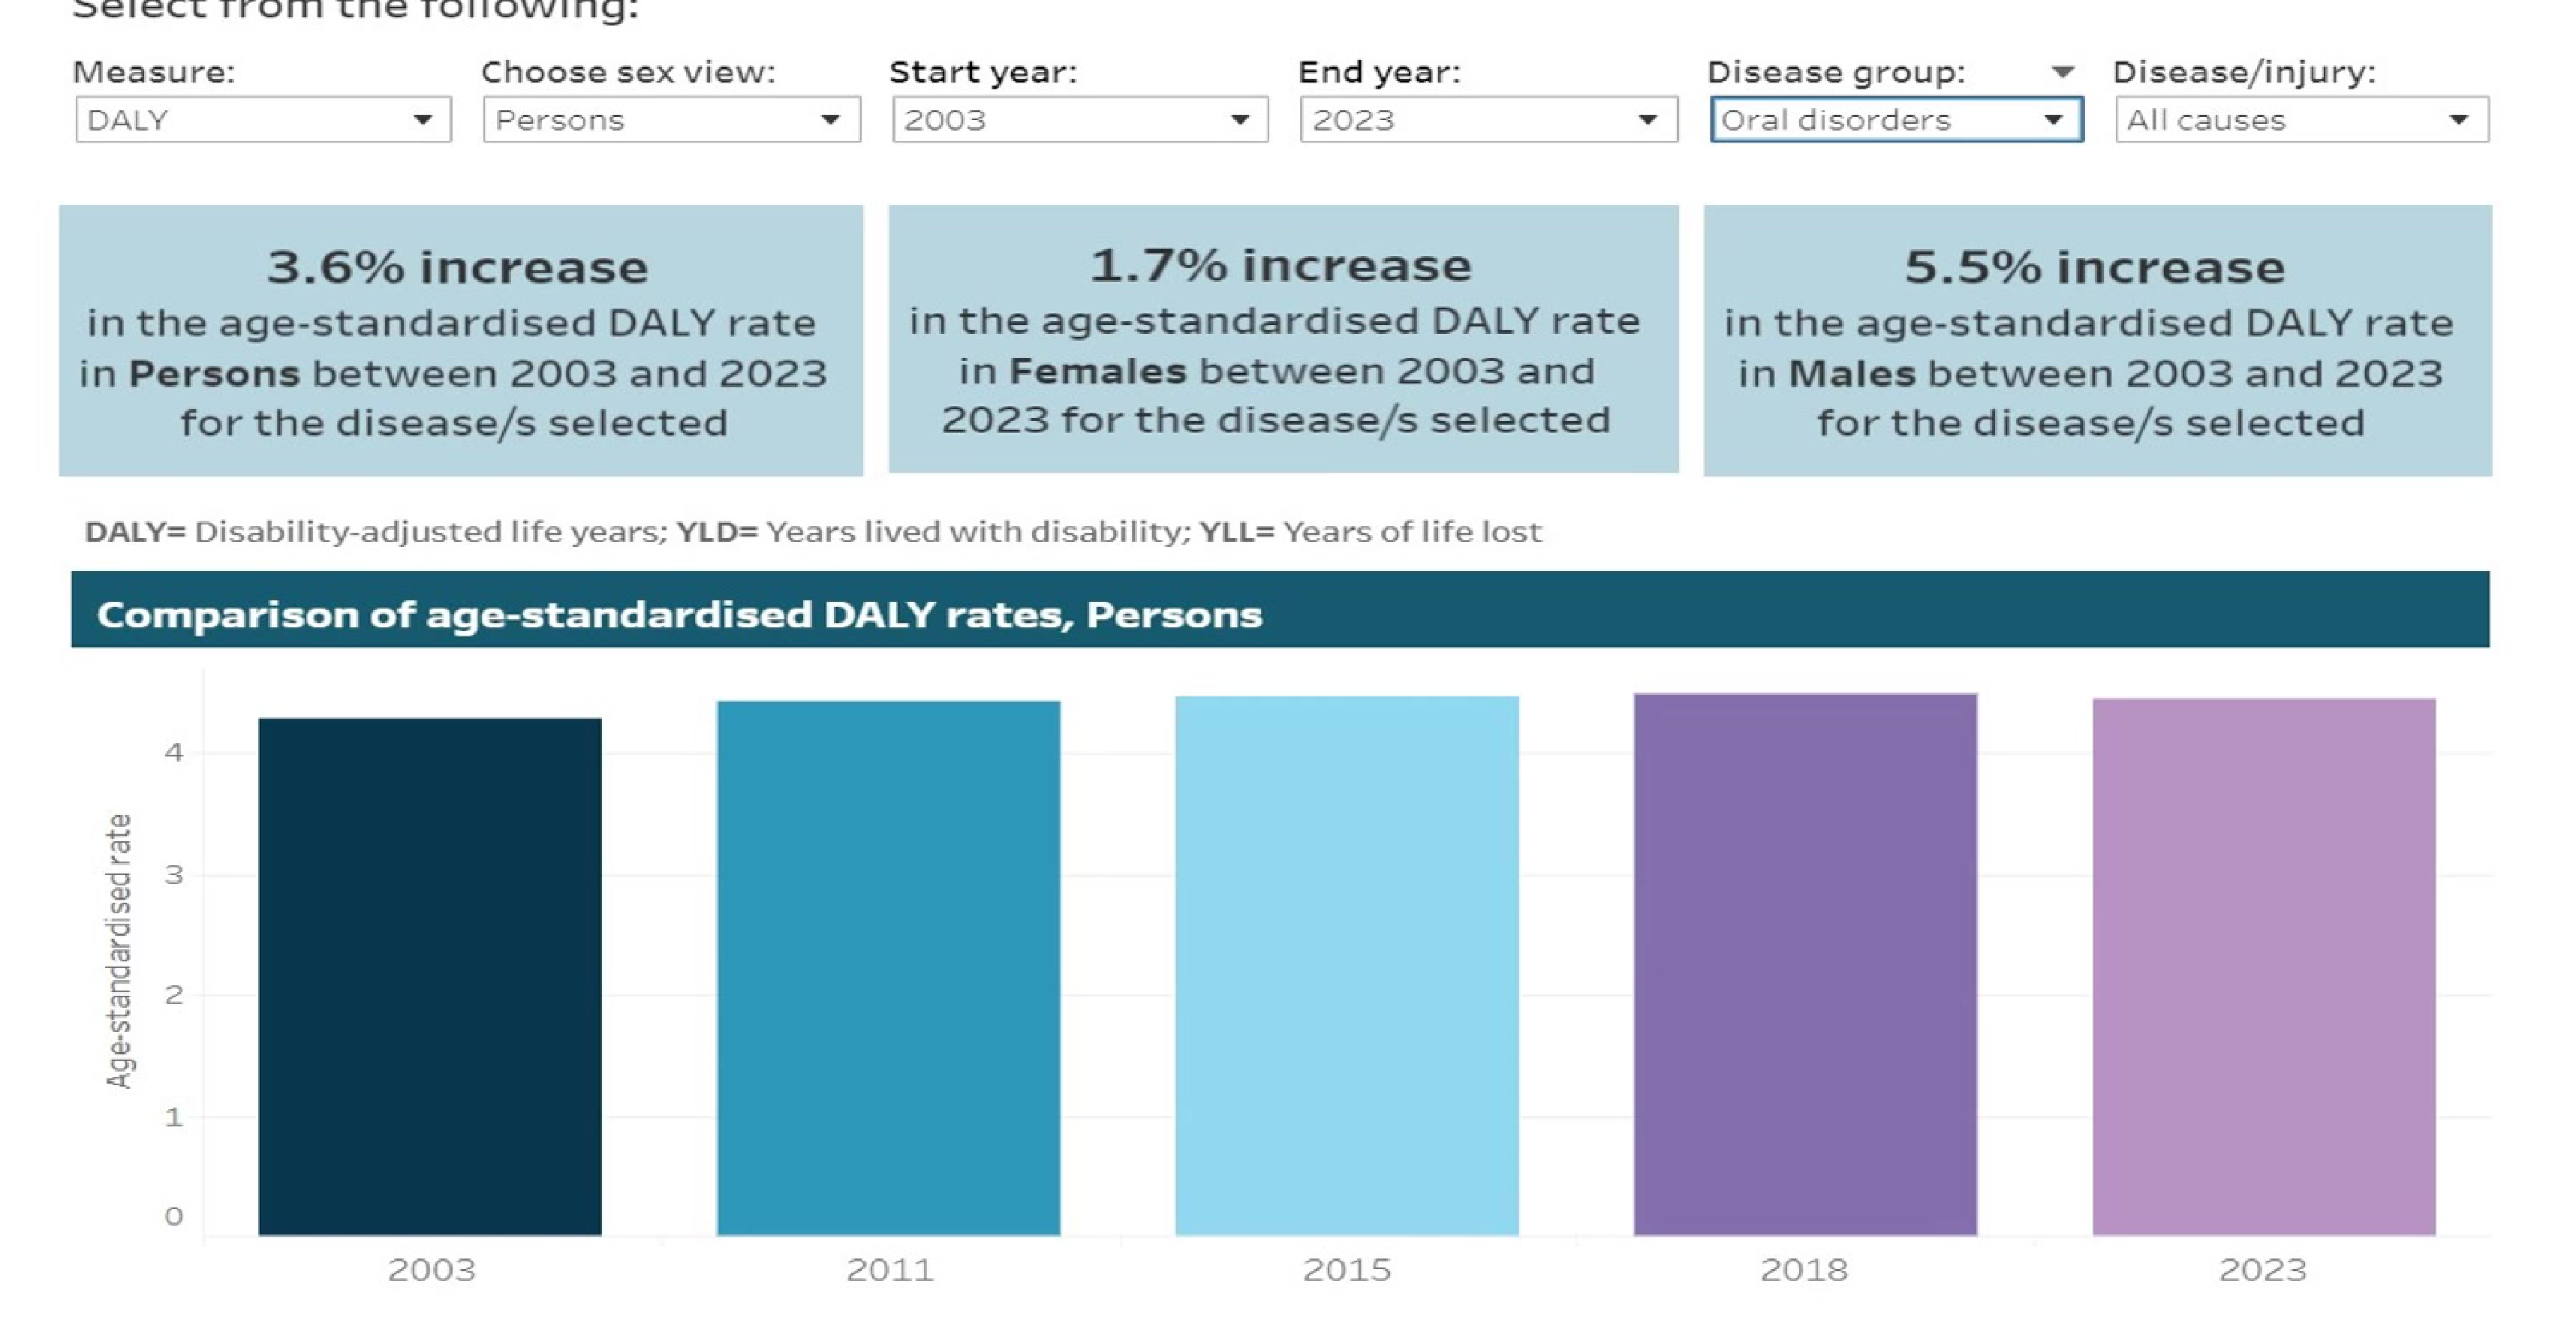
Changes in Age-Standardised DALY Rates (2003–2023)
- Persons: 3.6% increase
- Females: 1.7% increase
- Males: 5.5% increase
Lecturer — DALY Burden
The increase in burden occurred despite a gradual decline in prevalence. The lecturer linked this largely to increased life expectancy, because people may live longer with the consequences of oral conditions.
DALY = Disability-adjusted life years; YLD = Years lived with disability; YLL = Years of life lost
Comparison of Age-Standardised DALY Rates (Persons)
| Year | Age-standardised rate |
|---|---|
| 2003 | 4 |
| 2011 | 5 |
| 2015 | 4 |
| 2018 | 5 |
| 2023 | 5 |
Source: Australian Institute of Health and Welfare (2023) Australian Burden of Disease Study 2023, AIHW, Australian Government, accessed 28 July 2024. https://www.aihw.gov.au/reports/burden-of-disease/australian-burden-of-disease-study-2023/contents/interactive-data-on-disease-burden/comparisons-over-time
Dental Caries
Study Parameters9
-
Measure: DALY
-
Sex view: Persons
-
Period: 2003–2023
-
Disease group: Oral disorders
-
Disease/Injury: Dental caries
-
Dental caries was considered one of the oral conditions contributing to YLD and overall oral disease burden.
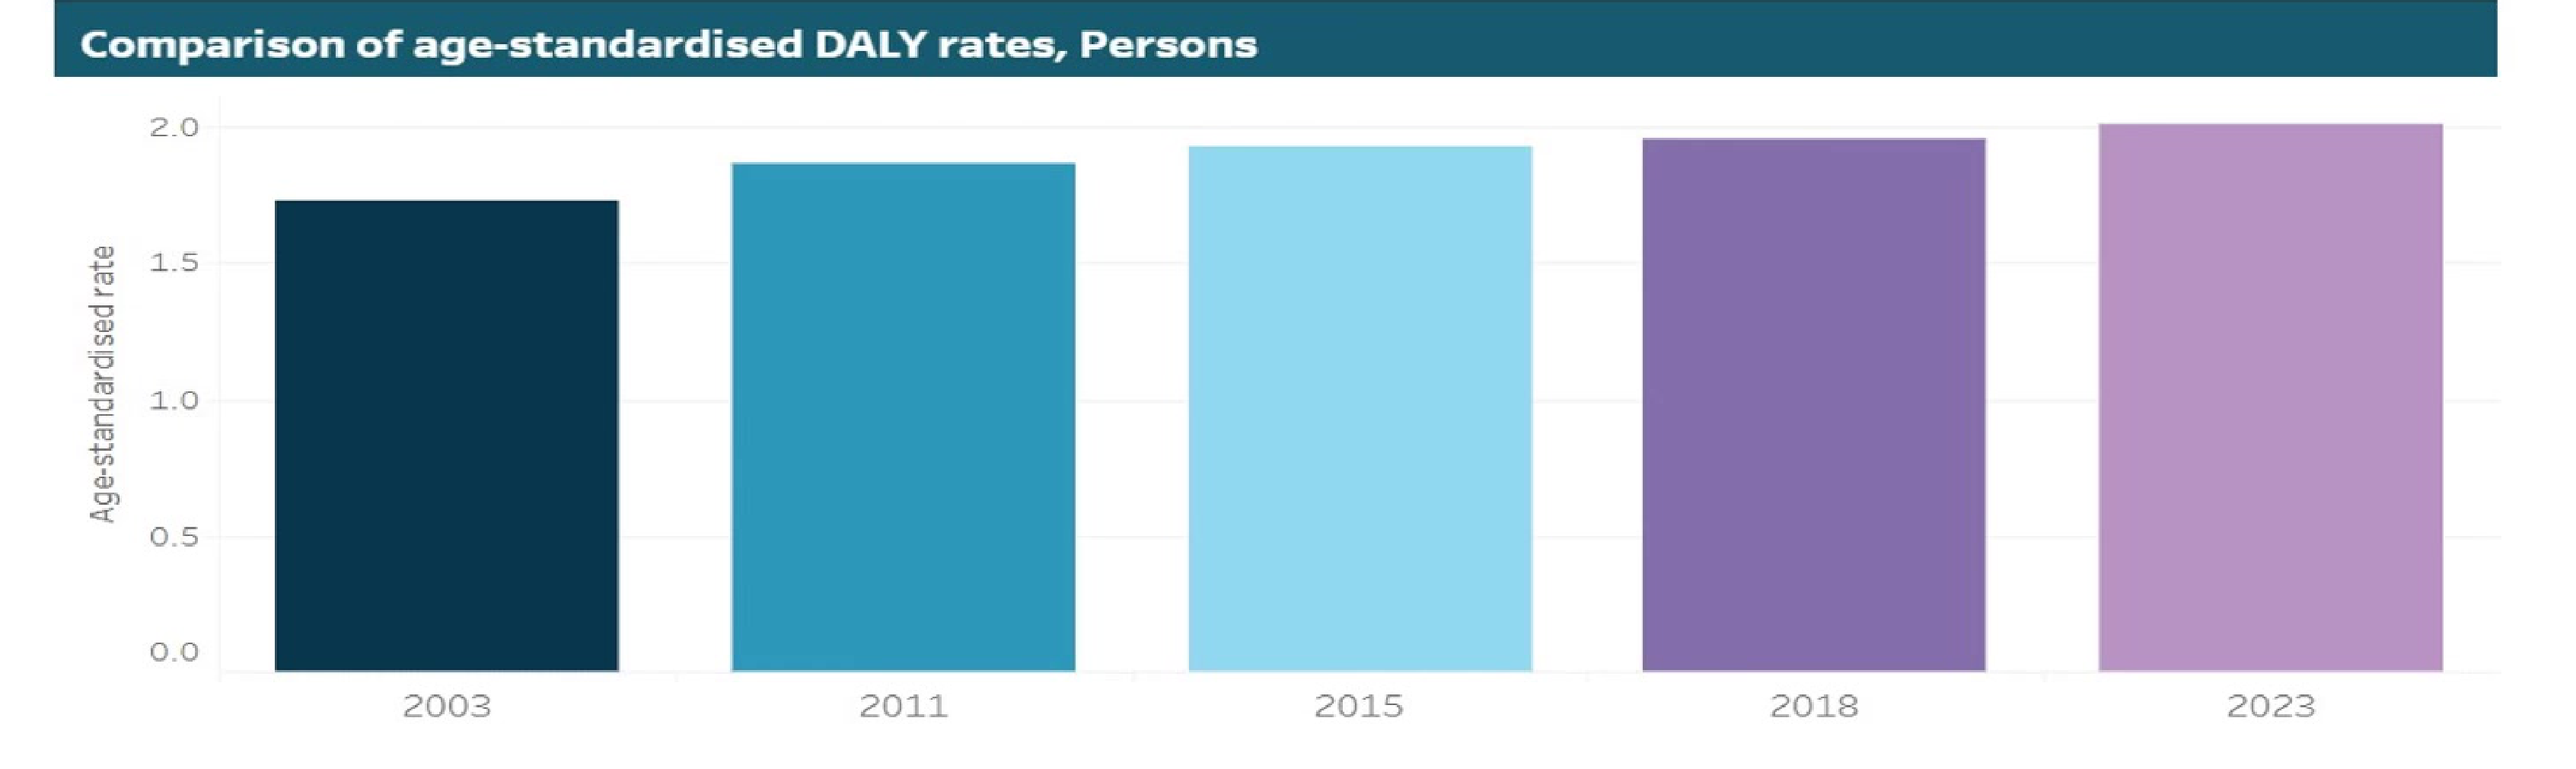
Changes in Age-Standardised DALY Rates (2003–2023)
- Persons: 16.4% increase
- Females: 19.9% increase
- Males: 13.3% increase
Lecturer — Dental Caries Trends
The lecturer linked the burden findings to longer life expectancy and people retaining their teeth for longer, rather than interpreting them simply as increased prevalence.
- The decline in severe tooth loss may indicate that treatment is effective and people are losing teeth later or less frequently.
- Dental caries prevalence has shown a temporal decline, particularly in developed parts of the world, associated with dental public health programs such as water fluoridation.
DALY = Disability-adjusted life years; YLD = Years lived with disability; YLL = Years of life lost
Source: Australian Institute of Health and Welfare (2023) Australian Burden of Disease Study 2023, AIHW, Australian Government, accessed 28 July 2024. https://www.aihw.gov.au/reports/burden-of-disease/australian-burden-of-disease-study-2023/contents/interactive-data-on-disease-burden/comparisons-over-time
Periodontal Disease
Study Parameters10
- Measure: DALY
- Sex view: Persons
- Period: 2003–2023
- Disease group: Oral disorders
- Disease/Injury: Periodontal disease
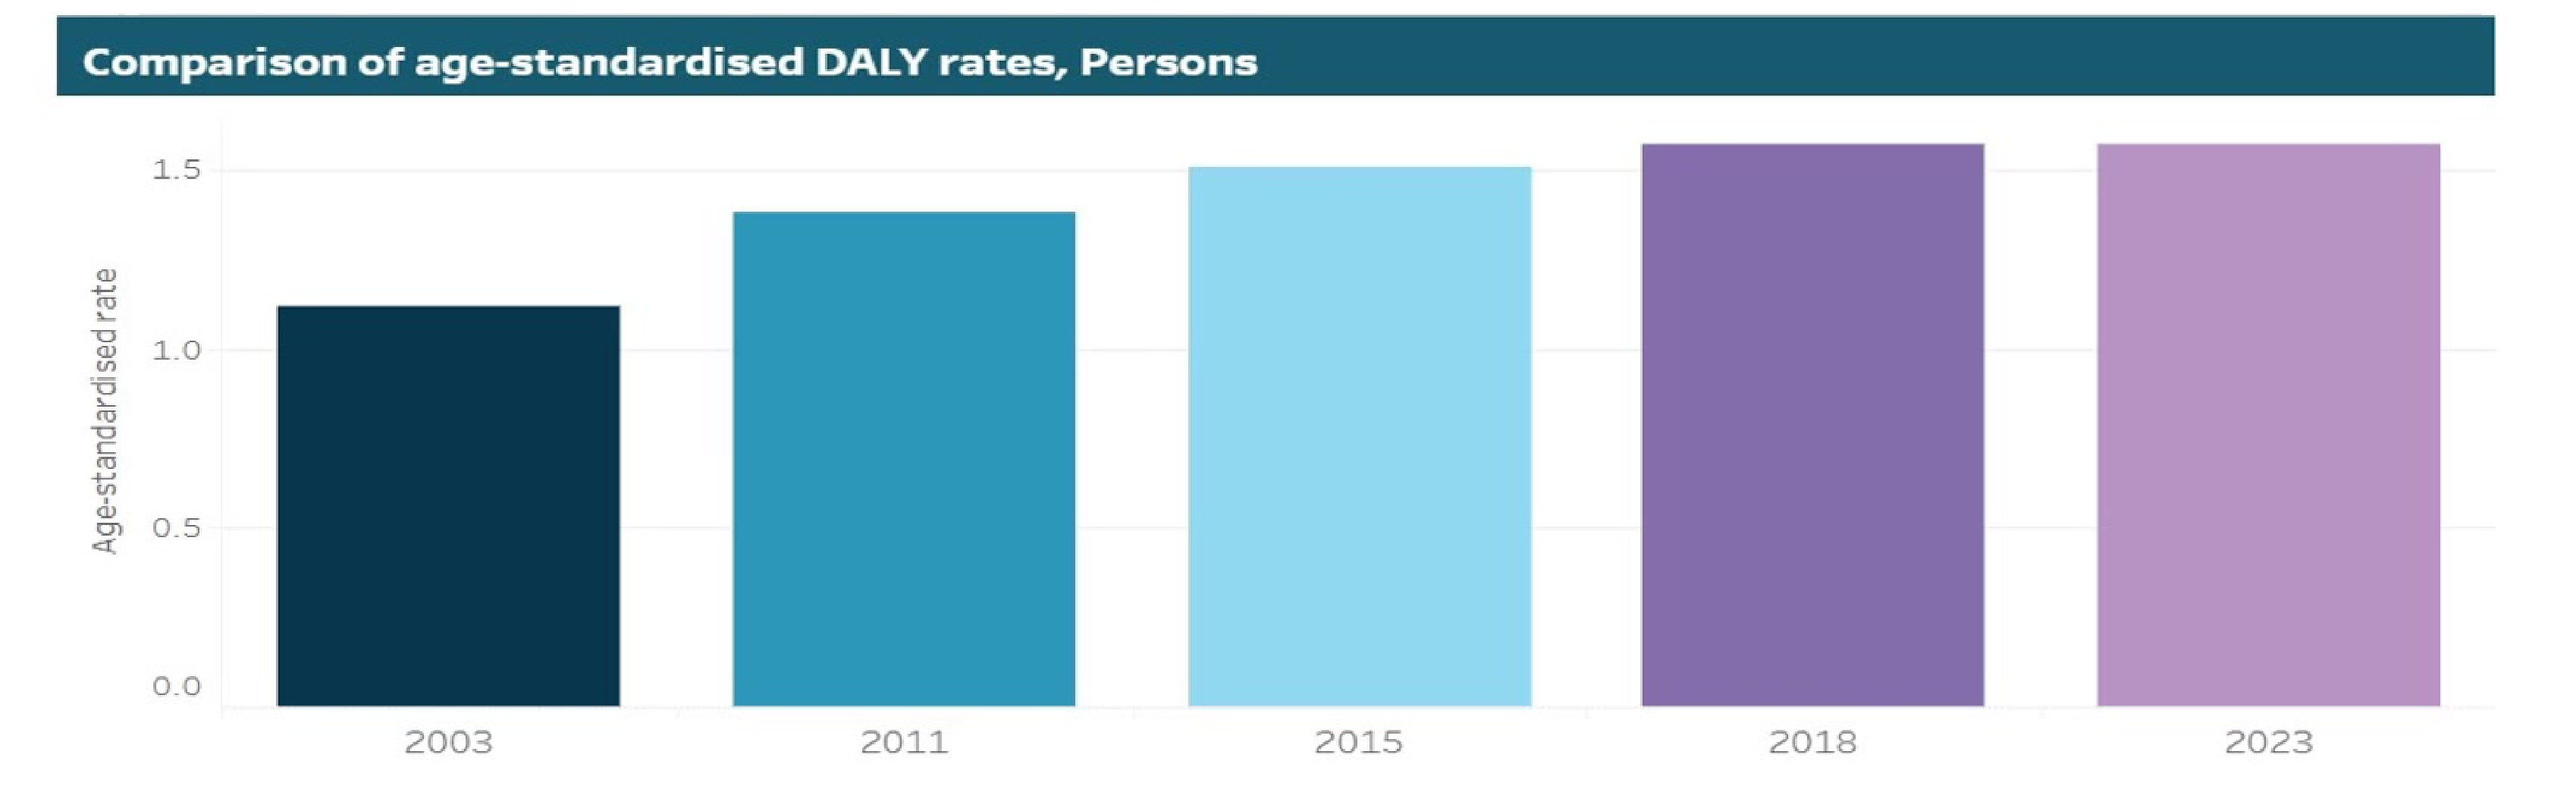
Changes in Age-Standardised DALY Rates (2003–2023)
- Persons: 40.1% increase
- Females: 47.6% increase
- Males: 34.8% increase
Lecturer — Periodontal Disease Burden
The lecturer suggested that retaining teeth for longer can mean that people live longer with periodontal disease rather than losing affected teeth earlier. A decline in prevalence does not necessarily produce a decline in DALYs because DALYs also reflect life expectancy and the time people live with a condition.
DALY = Disability-adjusted life years; YLD = Years lived with disability; YLL = Years of life lost
Comparison of Age-Standardised DALY Rates (Persons)
Source: Australian Institute of Health and Welfare (2023) Australian Burden of Disease Study 2023, AIHW, Australian Government, accessed 28 July 2024. https://www.aihw.gov.au/reports/burden-of-disease/australian-burden-of-disease-study-2023/contents/interactive-data-on-disease-burden/comparisons-over-time
Severe Tooth Loss
Study Parameters11
- Measure: DALY
- Sex view: Persons
- Period: 2003–2023
- Disease group: Oral disorders
- Disease/Injury: Severe tooth loss
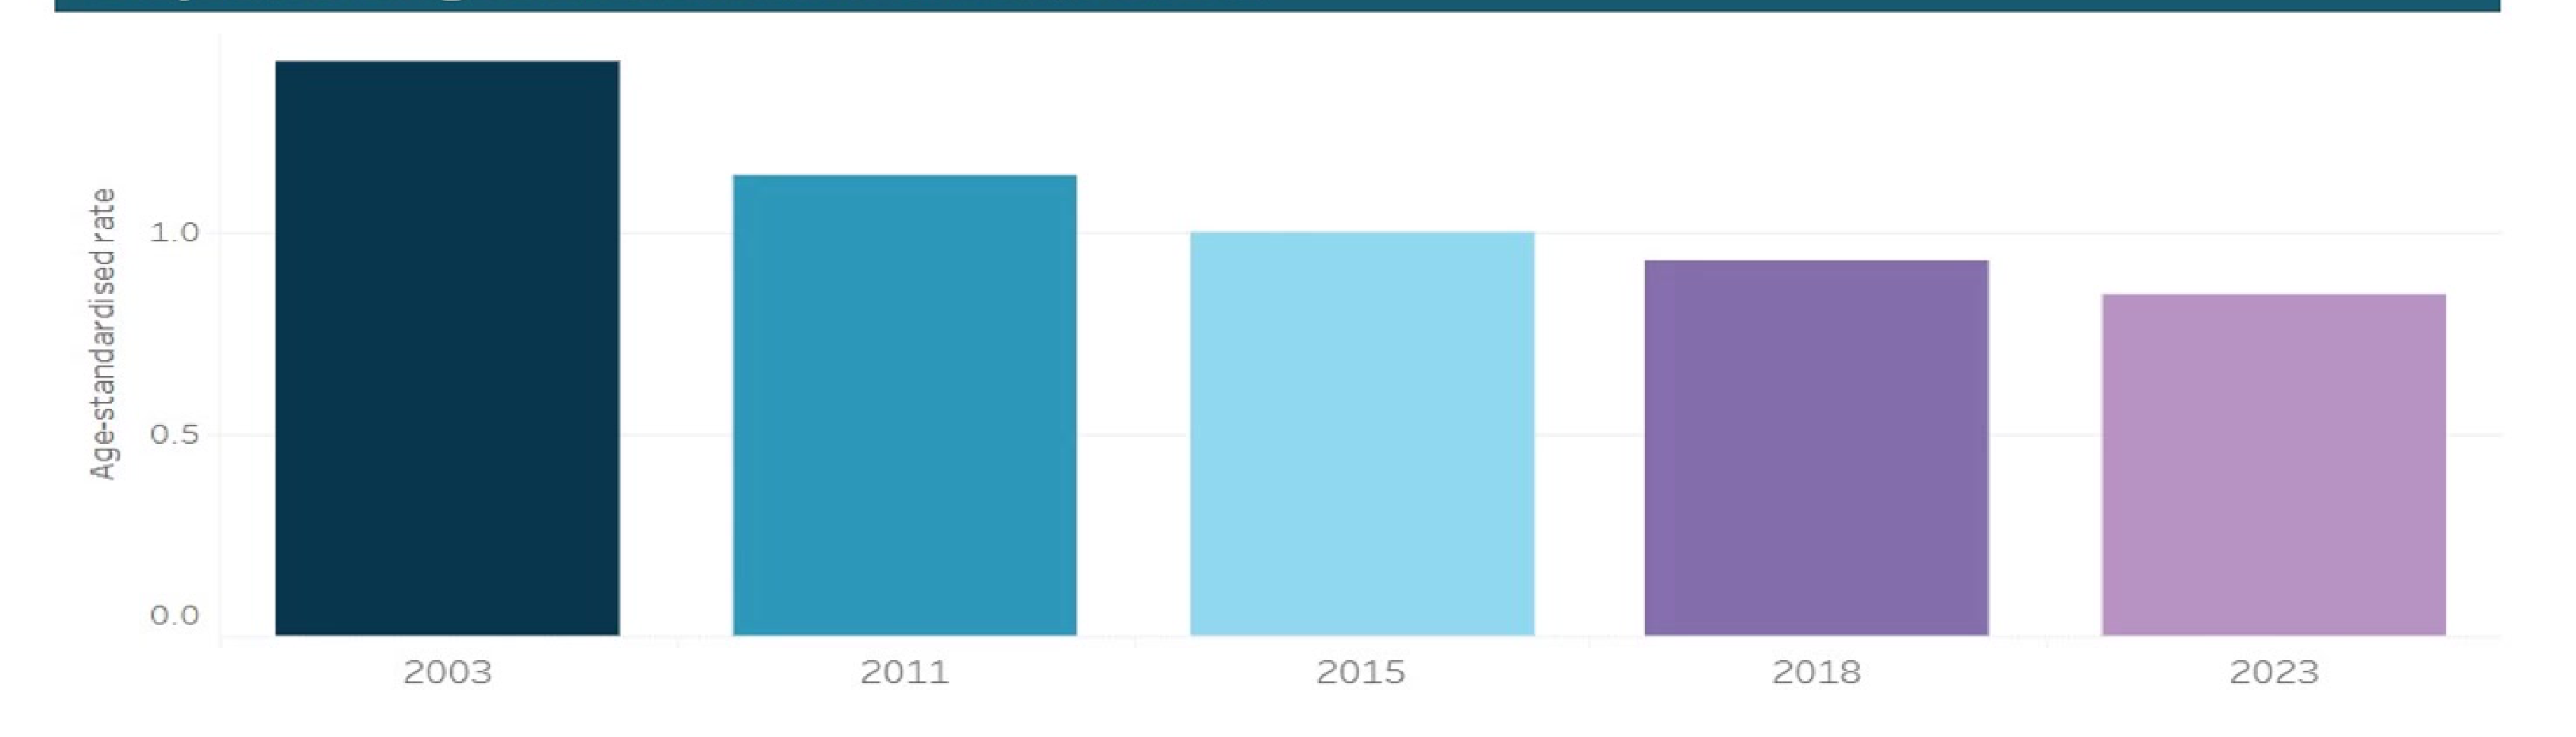
Changes in Age-Standardised DALY Rates (2003–2023)
- Persons: 40.7% decrease
- Females: 43.2% decrease
- Males: 37.2% decrease
Lecturer — Severe Tooth Loss
The substantial decline in severe tooth loss may indicate that people are receiving treatment and retaining their teeth for longer. It may also help explain the increased periodontal-disease burden, because people may live longer with periodontal disease rather than losing teeth earlier.
DALY = Disability-adjusted life years; YLD = Years lived with disability; YLL = Years of life lost
Comparison of Age-Standardised DALY Rates (Persons)
- Years: 2003, 2011, 2015, 2018, 2023
- Age-standardised rate scale: 0.0 to 12.0
Source: Australian Institute of Health and Welfare (2023) Australian Burden of Disease Study 2023, AIHW, Australian Government, accessed 28 July 2024. https://www.aihwww.gov.au/reports/burden-of-disease-australian-burden-of-disease-study-2023/contents/interactive-data-on-disease-burden/32012/
Lip and Oral Cavity Cancer
Study Parameters12
-
Measure: DALY
-
Sex view: Persons
-
Period: 2003–2023
-
Disease group: Cancer and other neoplasms
-
Disease/Injury: Lip and oral cavity cancer
-
Lip and oral cavity cancer is reported under neoplasms rather than in the general oral-disorder category, so it must be considered separately when assessing the complete burden of oral disease.
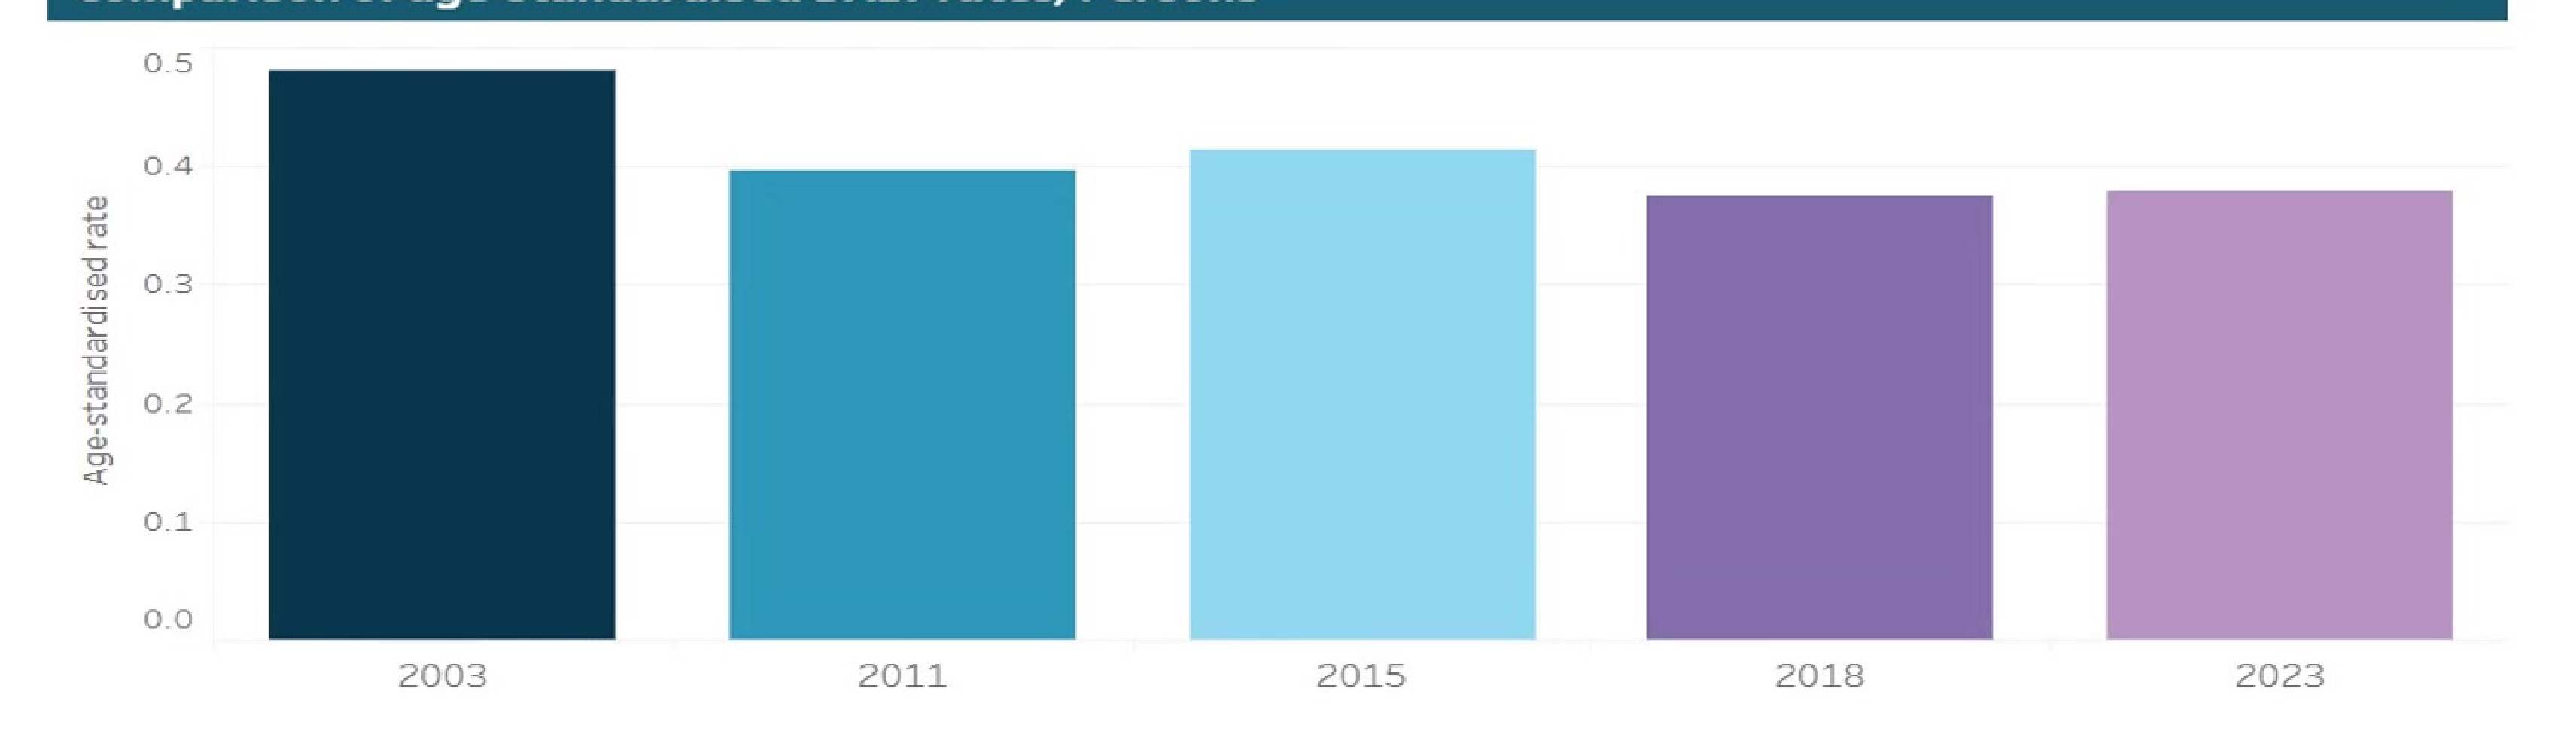
Changes in Age-Standardised DALY Rates (2003–2023)
- Persons: 21.1% decrease
- Females: 20.9% decrease
- Males: 20.6% decrease
Lecturer — Oral Cancer Trends
The lecturer suggested that anti-tobacco legislation may have contributed to the decline in lip and oral cavity cancer burden. Measures concerning cigarette advertising were mentioned as one possible influence on oral-cancer prevalence and burden.
DALY = Disability-adjusted life years; YLD = Years lived with disability; YLL = Years of life lost
Comparison of Age-Standardised DALY Rates (Persons)
Source: Australian Institute of Health and Welfare (2023) Australian Burden of Disease Study 2023, AIHW, Australian Government, accessed 28 July 2024. https://www.aihw.gov.au/reports/burden-of-disease/australian-burden-of-disease-study-2023/contents/interactive-data-on-disease-burden/comparisons-over-time
Cleft Lip and Palate
Study Parameters13
-
Measure: DALY
-
Sex view: Persons
-
Period: 2003–2023
-
Disease group: Infant and congenital disorders
-
Disease/Injury: Cleft lip and/or palate
-
Cleft lip and palate is reported under congenital conditions rather than in the general oral-disorder category, so it should be considered separately when assessing overall oral-disease burden.
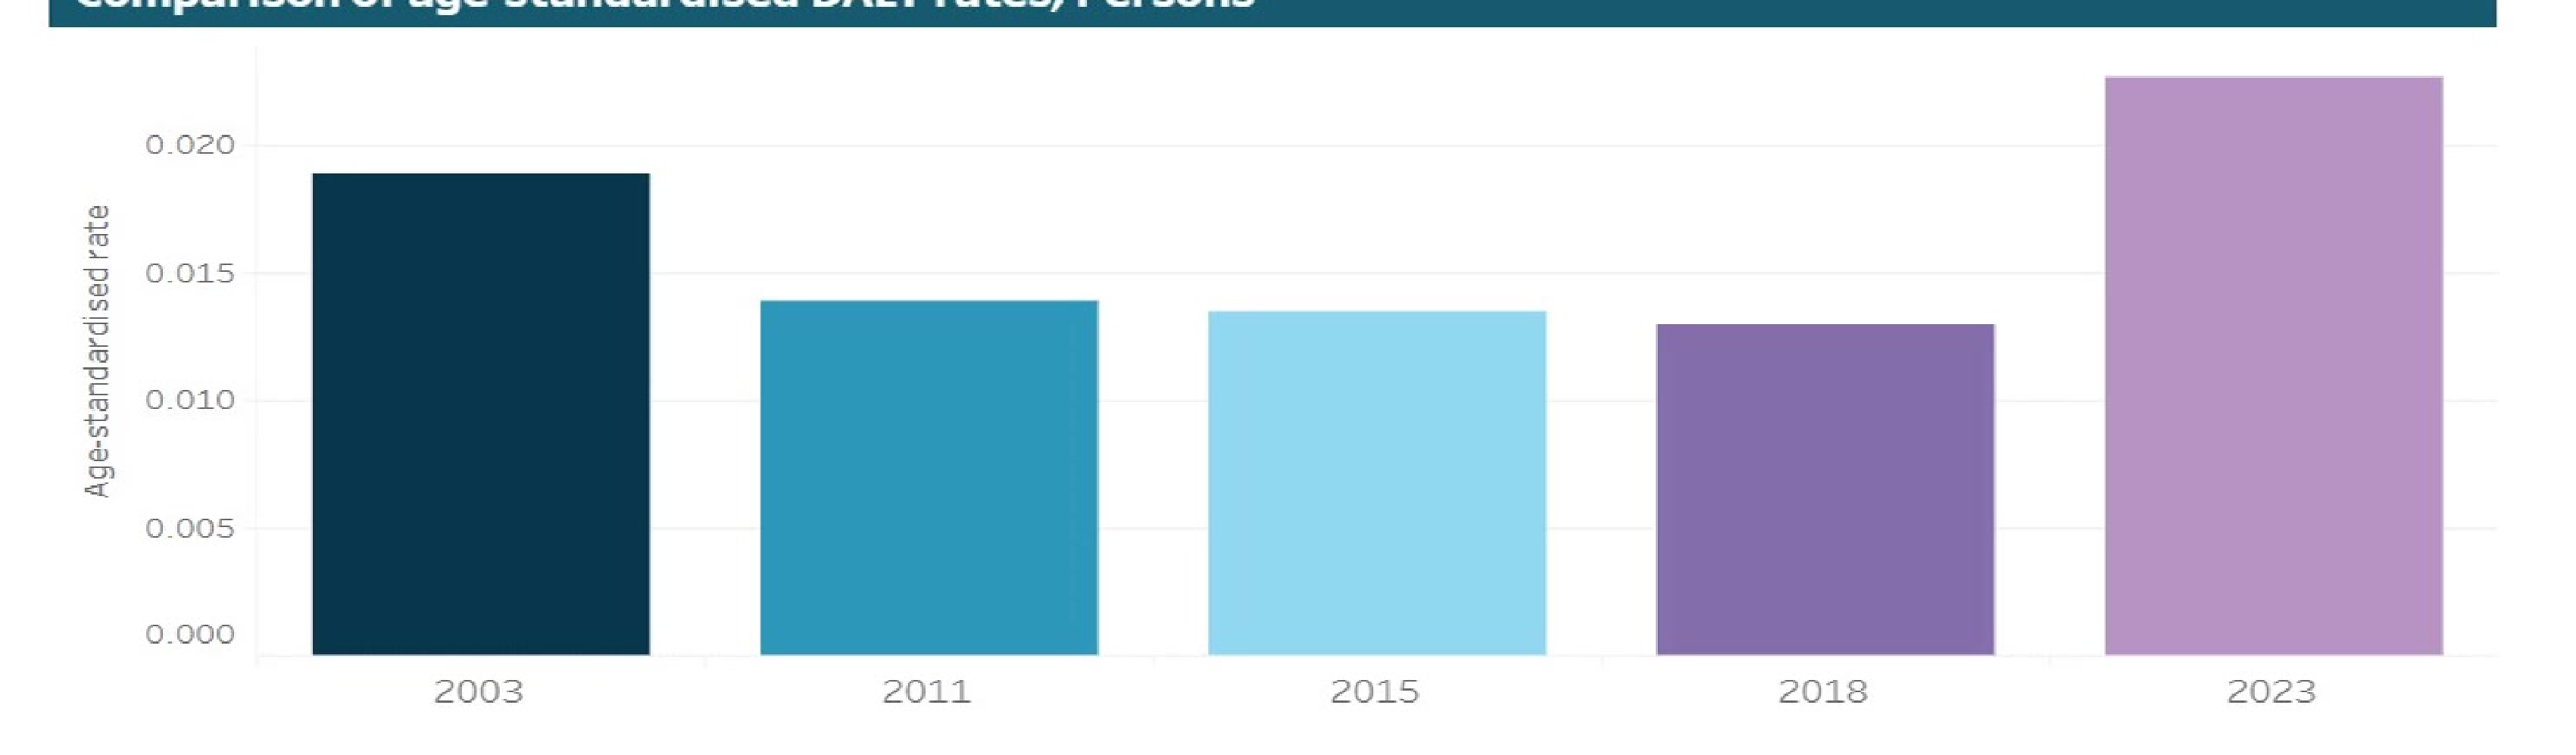
Changes in Age-Standardised DALY Rates (2003–2023)
- Persons: 19.8% increase
- Females: 19.1% decrease
- Males: 80.4% increase
Lecturer — Cleft Lip and Palate
The increase in burden may reflect changes in diagnosis and identification, including more frequent capture of syndromic conditions. A genuine rise in prevalence was also presented as a possibility, but not as a confirmed explanation.
Comparison of Age-Standardised DALY Rates (Persons)
- Years: 2003, 2011, 2015, 2018, 2023
- Age-standardised rate scale: 0.000 to 0.020
Source: Australian Institute of Health and Welfare (2023) Australian Burden of Disease Study 2023, AIHW, Australian Government, accessed 28 July 2024. https://www.aihw.gov.au/reports/burden-of-disease/australian-burden-of-disease-study-2023/contents/interactive-data-on-disease-burden/comparisons-over-time
Disproportionate Prevalence and Strategic Approaches
Population Breakdown14
- Indigenous Status: Australia, Indigenous, Non-Indigenous
- Remoteness: Major cities, Inner regional, Outer regional, Remote/very remote
- Household Income: Low, Medium, High
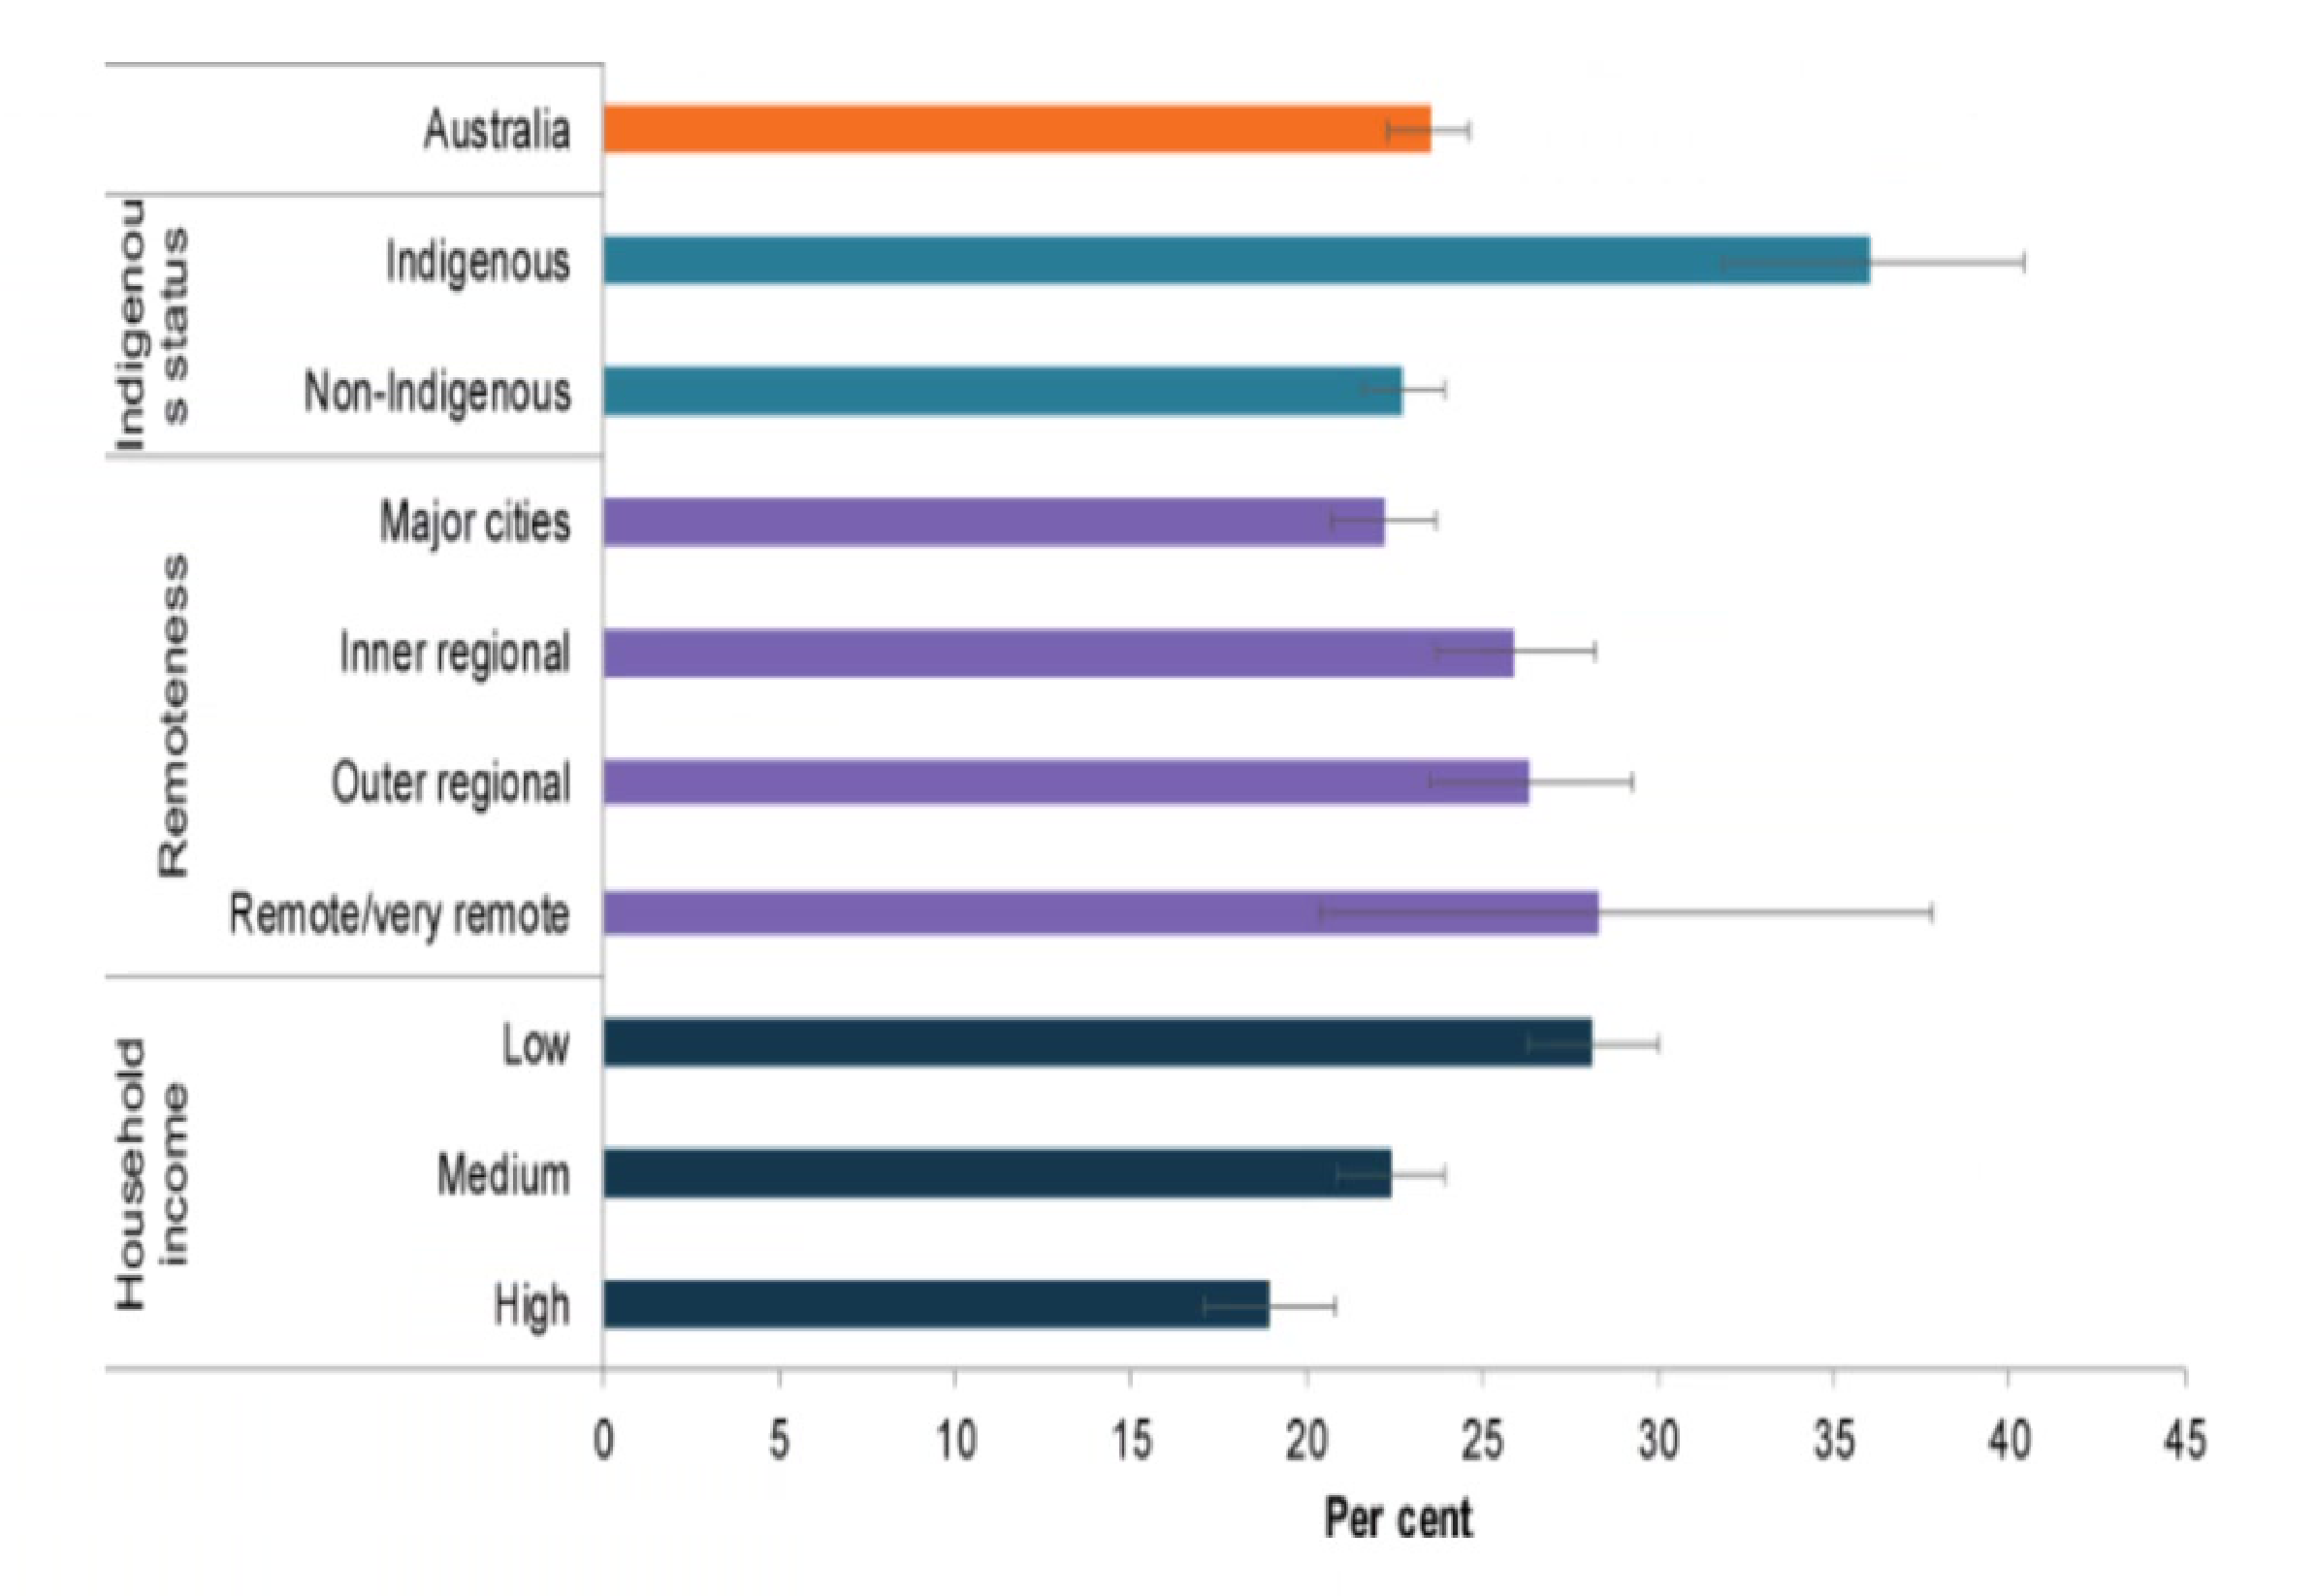
Prevalence of Oral Disease Is Disproportionate
Source: National Child Oral Health Study 2012–14, published in Ha et al. 2016.
Lecturer — Unequal Disease Burden
A general decline in oral disease does not mean that every population group is experiencing the same decline.
- Some groups continue to experience a high burden because of social, economic, geographic or health-related circumstances.
- Population-level averages should not be interpreted as representing the experience of all groups.
Australian Institute of Health and Welfare (2023) Oral health and dental care in Australia, AIHW, Australian Government, accessed 15 January 2024.
Strategic Approach to Population Oral Health15
- Whole population approach
- Targeted population approach
- High risk individual approach
- Proportionate universalism
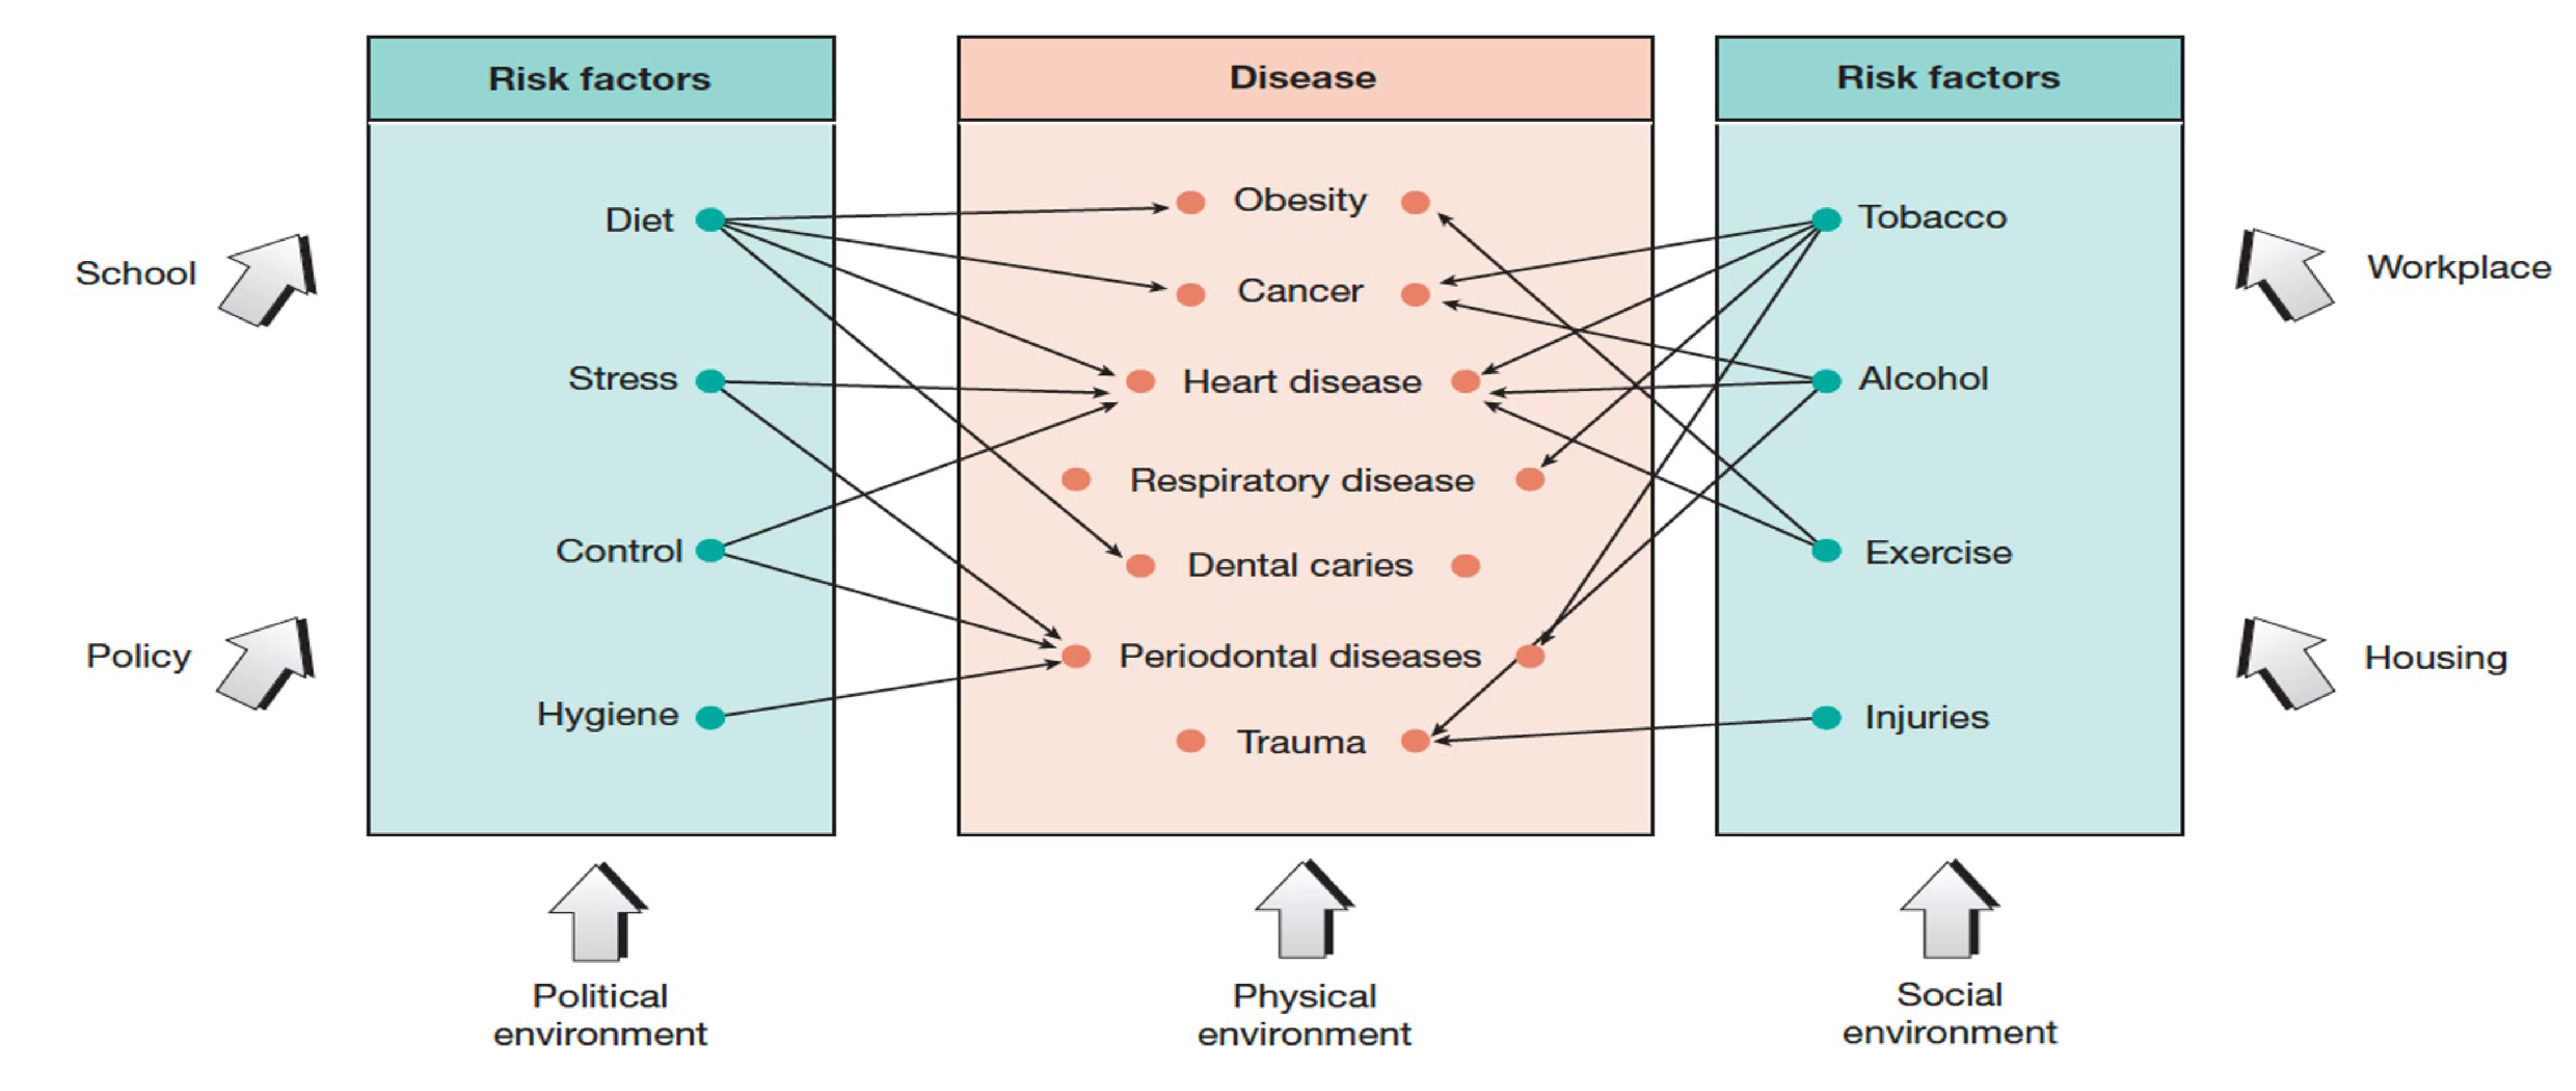
Common Risk Factor Approach in Dental Public Health
Key Components and Environments16
- Settings & Contexts: School, Workplace, Housing, Policy
- Broader Environments: Physical environment, Social environment, Political environment
- Risk Factors: Diet, Stress, Tobacco, Alcohol, Exercise, Control
- Conditions & Outcomes: Obesity, Cancer, Heart disease, Respiratory disease, Dental caries, Periodontal diseases, Trauma, Injuries
Source: Ivor G Chestnutt, Dental Public Health at a Glance, John Wiley & Sons, Inc., 2016.
Lecturer — Funding and Approaches
Population oral health planning is shaped by limited funding, because public dental schemes are largely government funded and oral conditions may be viewed as less severe than conditions addressed by mental health or cardiovascular programs.
- The whole-population approach aims to influence everyone; water fluoridation was given as an example, although population-wide interventions can require substantial funding and may not be feasible for every condition.
- The targeted-population approach focuses services on a defined group; school dental services were given as an example because children may be more susceptible to preventable oral conditions.
- The high-risk approach focuses on people with particular risk factors; smoking cessation was given as an example, although measured risk may not fully reflect a person’s need for care.
- Need can include both objective and subjective aspects, including whether a person considers that they require care.
Lecturer — Proportionate Universalism
Proportionate universalism aims to improve oral health across the entire population while directing additional priority to people with the greatest needs.
- The approach was associated with the Marmot report in the United Kingdom, its adoption across most OECD countries including Australia, and the National Oral Health Plan.
- It avoids treating the whole population as if every group has the same level of need by making resources and services proportionate to need.
Lecturer — Common Risk Factors
Oral health should be integrated with broader health because risk factors for oral conditions may also contribute to other health complications.
- Sugar was given as an example because it contributes to dental caries, diabetes and other conditions.
- Integrating oral health programs with other health programs may improve opportunities for funding and improve oral health outcomes.
Priority Populations Outlined by the National Oral Health Plan17
- People who are socially disadvantaged or on low incomes
- Aboriginal and Torres Strait Islander people
- People living in regional and remote Australia
- People with additional and/or specialised health care needs
Source: Australian Institute of Health and Welfare (2023) Oral health and dental care in Australia, AIHW, Australian Government, accessed 28 July 2024. https://www.aihw.gov.au/reports/dental-orl-health/oral-health-and-dental-care-in-australia/contents/priority-populations
Lecturer — Priority Group Details
The priority populations include more specific groups and access concerns than the broad categories listed in the plan.
- Social disadvantage includes culturally and linguistically diverse people, people experiencing substantial economic disadvantage, and people who are homeless.
- Aboriginal and Torres Strait Islander people were also referred to as First Nations people.
- People with additional or specialised healthcare needs include geriatric populations, people living in aged care, and people living with disability.
- People in regional and remote areas may experience difficulty accessing dental care.
Audio Appendix
Additional Audio Content
The following sections from the lecture audio did not correspond to any heading in the main document.
Leading Causes of DALY and YLD Globally
Leading Causes
Global burden-of-disease studies are frequently published in leading journals, including The Lancet.
- The more recent global burden-of-disease study referred to in the lecture was from 2021.
- Results are presented using cartograms.
- In an earlier presentation of global findings, low back pain was identified as the largest contributor to burden in Australia, although this had subsequently changed.
When interpreting DALYs, it is useful to examine both of its components separately:
- YLL, which represents premature mortality.
- YLD, which represents time lived with disability.
This is particularly important for oral disease because many oral conditions cause considerable morbidity but do not cause substantial mortality. Oral cancer is an important exception.
Illustrative Locations
The DALY findings differ from prevalence and incidence findings because DALYs incorporate the impact of disease and the time lived with disability.
- DALYs for oral conditions may appear higher in OECD countries.
- This may be related to higher life expectancy in those countries, which increases the amount of time over which the impact of a condition is experienced.
- In contrast, prevalence and incidence of oral conditions may be substantially higher in Asian countries.
- Prevalence and incidence mainly count cases, whereas DALYs also reflect the consequences of those conditions.
Leading Causes of Years Lived with Disability (YLD)
Among the leading causes contributing to YLD globally:
- Oral disorders featured among the top 12 of the 25 conditions discussed.
- This indicates that oral disorders make a substantial contribution to the amount of time people live with disability.
- In the Australian 2023 burden-of-disease findings, dental caries ranked 15th among the leading causes of YLD.
The Australian dental caries finding is based on population data and demonstrates that dental caries makes a significant contribution to disability, even though it does not usually cause substantial mortality.
Leading Causes of Disability-Adjusted Life Years (DALY)
In the Australian burden-of-disease findings from 2023:
- Coronary heart disease was the leading contributor to DALYs.
- Back pain followed coronary heart disease.
- This differed from the earlier global burden-of-disease findings, illustrating that rankings can change over relatively short periods.
Global Burden of Oral Conditions
In global burden-of-disease reporting, “oral disorders” do not include every condition that dental professionals might regard as an oral disorder.
The oral-disorder category generally includes:
- Deciduous tooth caries.
- Permanent tooth caries.
- Periodontal disease.
- Tooth loss.
- Other oral disorders.
However, it excludes:
- Lip and oral cavity cancer, which is reported under neoplasms.
- Cleft lip and palate, which is reported under congenital conditions.
Consequently, oral disease findings in burden-of-disease reports should be interpreted carefully. The reported category may not comprehensively represent the full burden of oral disease because oral cancer and specific congenital conditions are reported elsewhere.
Footnotes
-
Original PDF page 1: L2 Concepts behind burden of disease and priority populations in Australia slides, p.1 ↩
-
Original PDF page 3: L2 Concepts behind burden of disease and priority populations in Australia slides, p.3 ↩
-
Original PDF page 4: L2 Concepts behind burden of disease and priority populations in Australia slides, p.4 ↩
-
Original PDF page 5: L2 Concepts behind burden of disease and priority populations in Australia slides, p.5 ↩
-
Original PDF page 10: L2 Concepts behind burden of disease and priority populations in Australia slides, p.10 ↩
-
Original PDF page 11: L2 Concepts behind burden of disease and priority populations in Australia slides, p.11 ↩
-
Original PDF page 12: L2 Concepts behind burden of disease and priority populations in Australia slides, p.12 ↩
-
Original PDF page 13: L2 Concepts behind burden of disease and priority populations in Australia slides, p.13 ↩
-
Original PDF page 14: L2 Concepts behind burden of disease and priority populations in Australia slides, p.14 ↩
-
Original PDF page 15: L2 Concepts behind burden of disease and priority populations in Australia slides, p.15 ↩
-
Original PDF page 16: L2 Concepts behind burden of disease and priority populations in Australia slides, p.16 ↩
-
Original PDF page 17: L2 Concepts behind burden of disease and priority populations in Australia slides, p.17 ↩
-
Original PDF page 18: L2 Concepts behind burden of disease and priority populations in Australia slides, p.18 ↩
-
Original PDF page 19: L2 Concepts behind burden of disease and priority populations in Australia slides, p.19 ↩
-
Original PDF page 20: L2 Concepts behind burden of disease and priority populations in Australia slides, p.20 ↩
-
Original PDF page 21: L2 Concepts behind burden of disease and priority populations in Australia slides, p.21 ↩
-
Original PDF page 22: L2 Concepts behind burden of disease and priority populations in Australia slides, p.22 ↩