Burden Of Oral Disease Among Rural And Remote Populations
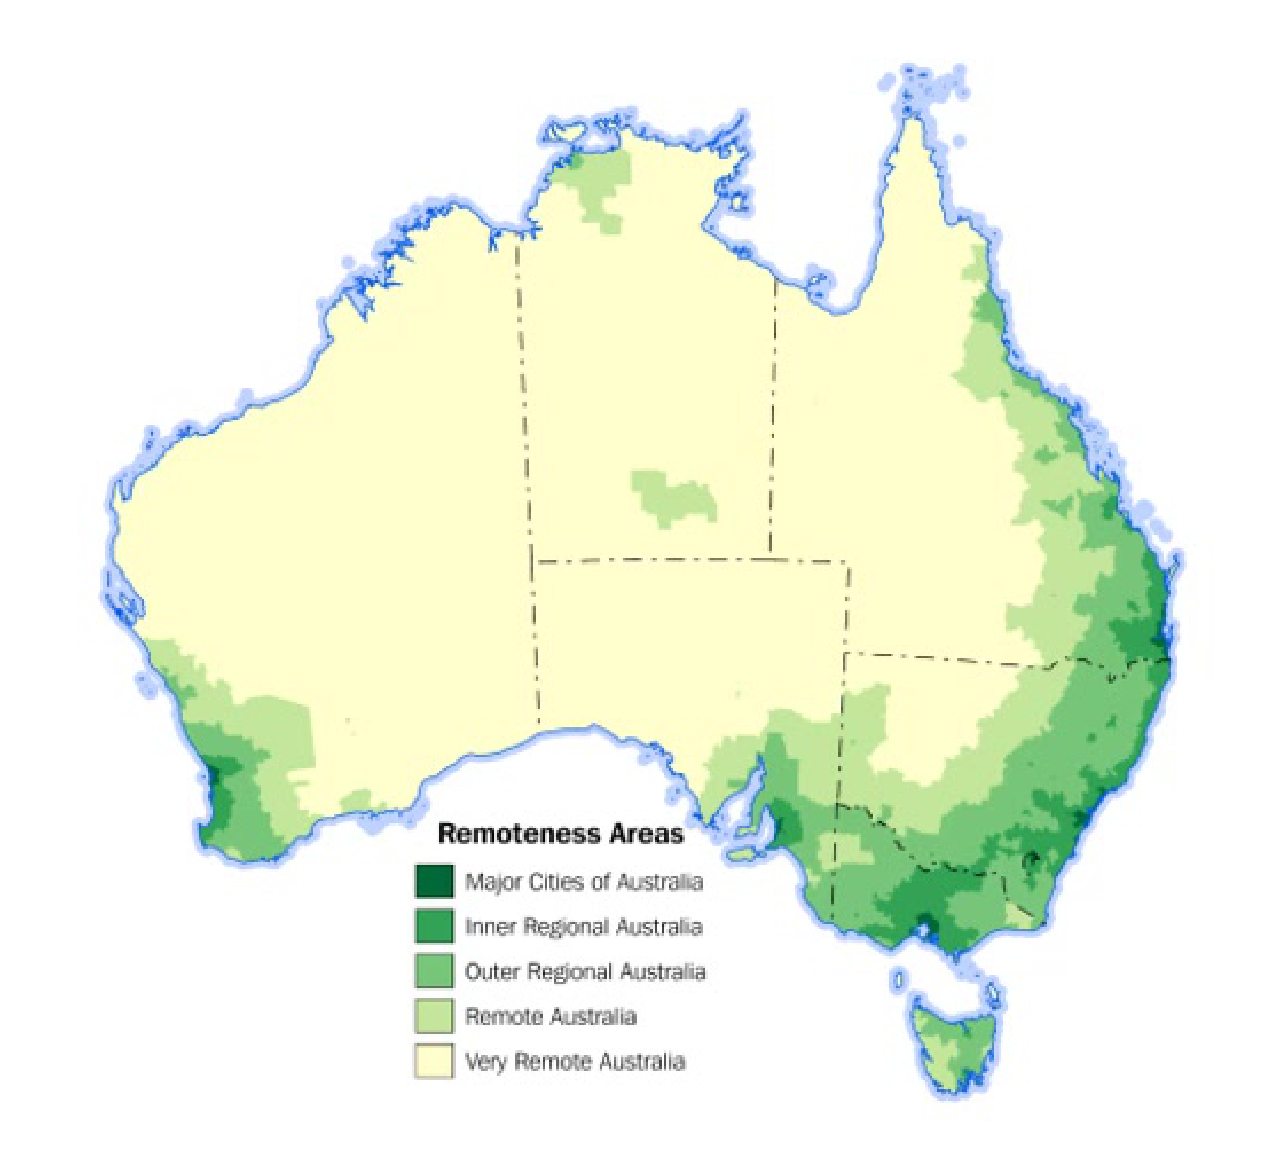
- Major Cities of Australia
- Inner Regional Australia
- Outer Regional Australia
- Remote Australia
- Very Remote Australia
Australian Bureau of Statistics (Jul2021-Jun2026), Remoteness Areas, ABS Website, accessed 28 July 2024.
Defining Rural And Remote Communities
Remoteness Areas Of Australia1
Image source: https://tgn.anu.edu.au/resource/rural-remote/
 |  |
Modified Monash Model
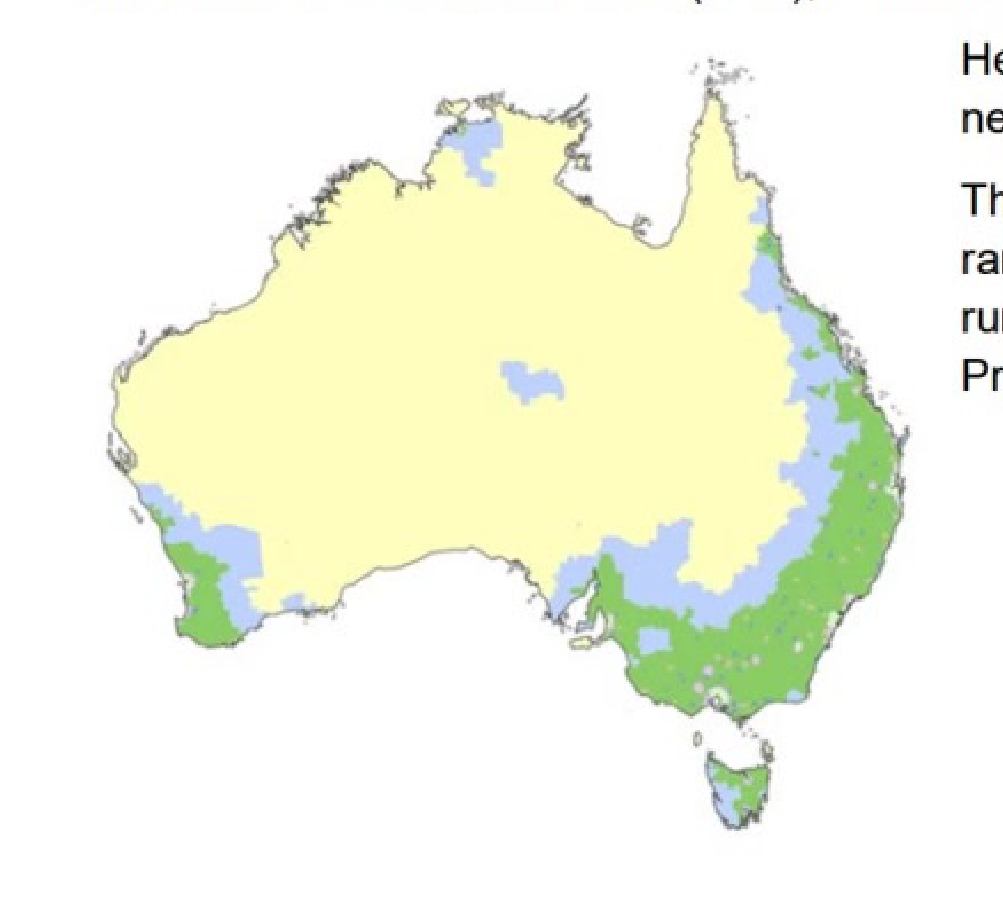
The Modified Monash Model (MMM) 2019 has been updated to align with the latest available census data (2016).
The model was developed to better target health workforce programs to attract health professionals to more remote and smaller communities. The MMM classifies metropolitan, regional, rural, and remote areas according to geographical remoteness, as defined by the Australian Bureau of Statistics (ABS), and town size.
Health programs will begin transitioning to the new MMM 2019 from 1 January 2020.
The MMM is used to determine eligibility for a range of health workforce programs, such as:
- Rural Bulk Billing Incentives
- Workforce Incentive Program
- Bonded Medical Program
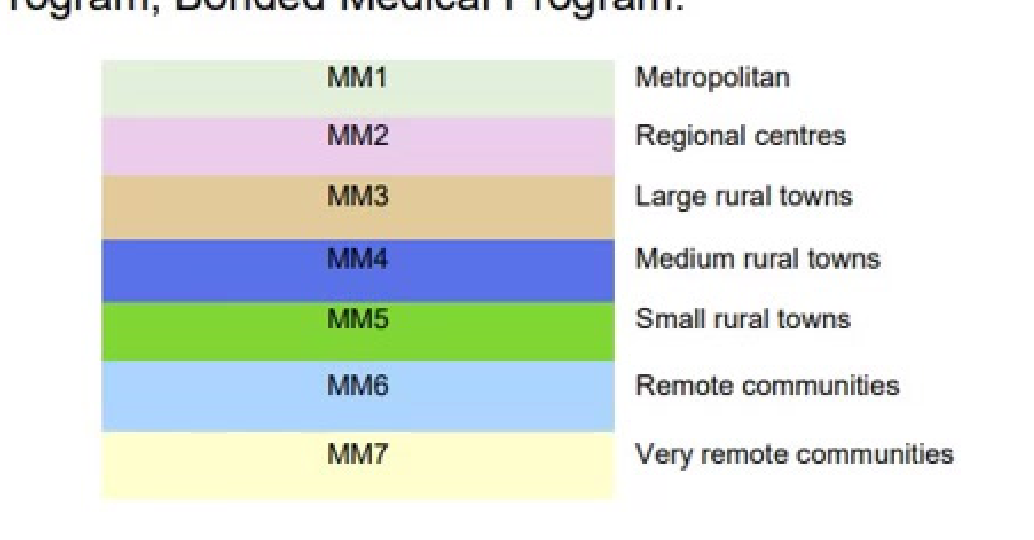
Modified Monash Categories (MMM 2019)2
| Modified Monash Category (MMM 2019) | Description (including the Australian Statistical Geography Standard – Remoteness Area (2016)) |
|---|---|
| MM 1 | Metropolitan areas: Major cities accounting for 70% of Australia’s population. All areas categorised ASGS-RA1. |
| MM 2 | Regional centres: Inner (ASGS-RA 2) and Outer Regional (ASGS-RA 3) areas that are in, or within a 20km drive of a town with over 50,000 residents. For example: Ballarat, Mackay, Toowoomba, Kiama, Albury, Bunbury. |
| MM 3 | Large rural towns: Inner (ASGS-RA 2) and Outer Regional (ASGS-RA 3) areas that are not MM 2 and are in, or within a 15km drive of a town between 15,000 to 50,000 residents. For example: Dubbo, Lismore, Yeppoon, Busselton. |
| MM 4 | Medium rural towns: Inner (ASGS-RA 2) and Outer Regional (ASGS-RA 3) areas that are not MM 2 or MM 3, and are in, or within a 10km drive of a town with between 5,000 to 15,000 residents. For example: Port Augusta, Charters Towers, Moree. |
| MM 5 | Small rural towns: All remaining Inner (ASGS-RA 2) and Outer Regional (ASGS-RA 3) areas. For example: Mount Buller, Moruya, Renmark, Condamine. |
| MM 6 | Remote communities: Remote mainland areas (ASGS-RA 4) AND remote islands less than 5kms offshore. For example: Cape Tribulation, Lightning Ridge, Alice Springs, Mallacoota, Port Hedland. Additionally, islands that have an MM 5 classification with a population of less than 1,000 without bridges to the mainland will now be classified as MM 6 (for example: Bruny Island). |
| MM 7 | Very remote communities: Very remote areas (ASGS-RA 5). For example: Longreach, Coober Pedy, Thursday Island, and all other remote island areas more than 5kms offshore. |
Source: https://www.health.gov.au/resources/publications/modified-monash-model-fact-sheet?language=en
 |  |
Oral Health Challenges In Rural And Remote Areas
- Transport: A lack of affordable or accessible transport. (There is a complex mix of non-emergency health transport funders, providers and programs that lack a consistent overarching framework approach.)
- Cost of goods: Increased cost of healthy food choices and oral hygiene products (including fluoride toothpaste).
Access Barriers To Care3
Australian Institute of Health and Welfare (2023) Oral health and dental care in Australia, AIHW, Australian Government, accessed 15 January 2024.
Lecturer — Rural Access Barriers
Rural and remote areas have fewer dental practitioners because their populations are smaller, and clinical infrastructure is limited.
- Specialist care is particularly difficult to access.
- Transport between communities can be challenging, including travel to primary health care centres.
- Access to fluoridated water is reduced in some parts of Australia, particularly Queensland; nearly 21% of Queensland was described as non-fluoridated.
- This was attributed to anti-fluoridation politics and the transfer of responsibility for fluoridating drinking water to local government areas and authorities.
- Rural and remote communities often include Indigenous and Aboriginal populations, who experience additional oral health challenges discussed in an earlier recording.
 |  |  |
 |  |
Burden Of Disease Data
Australian Burden of Disease Study 20184
- Measure: DALY (Disability-Adjusted Life Years)
- Year: 2018
- Sex: Persons
- Disease group: Oral disorders
Lecturer — Burden Data Sources
The lecture stated that there were no specific burden-of-disease findings available for some of the priority populations discussed.
- The National Oral Health Survey conducted in 2017–18 was used as a source of information for the older population.
Note: DALY = Disability-adjusted life years; YLL = Years of life lost; YLD = Years lived with disability.
Key Findings
-
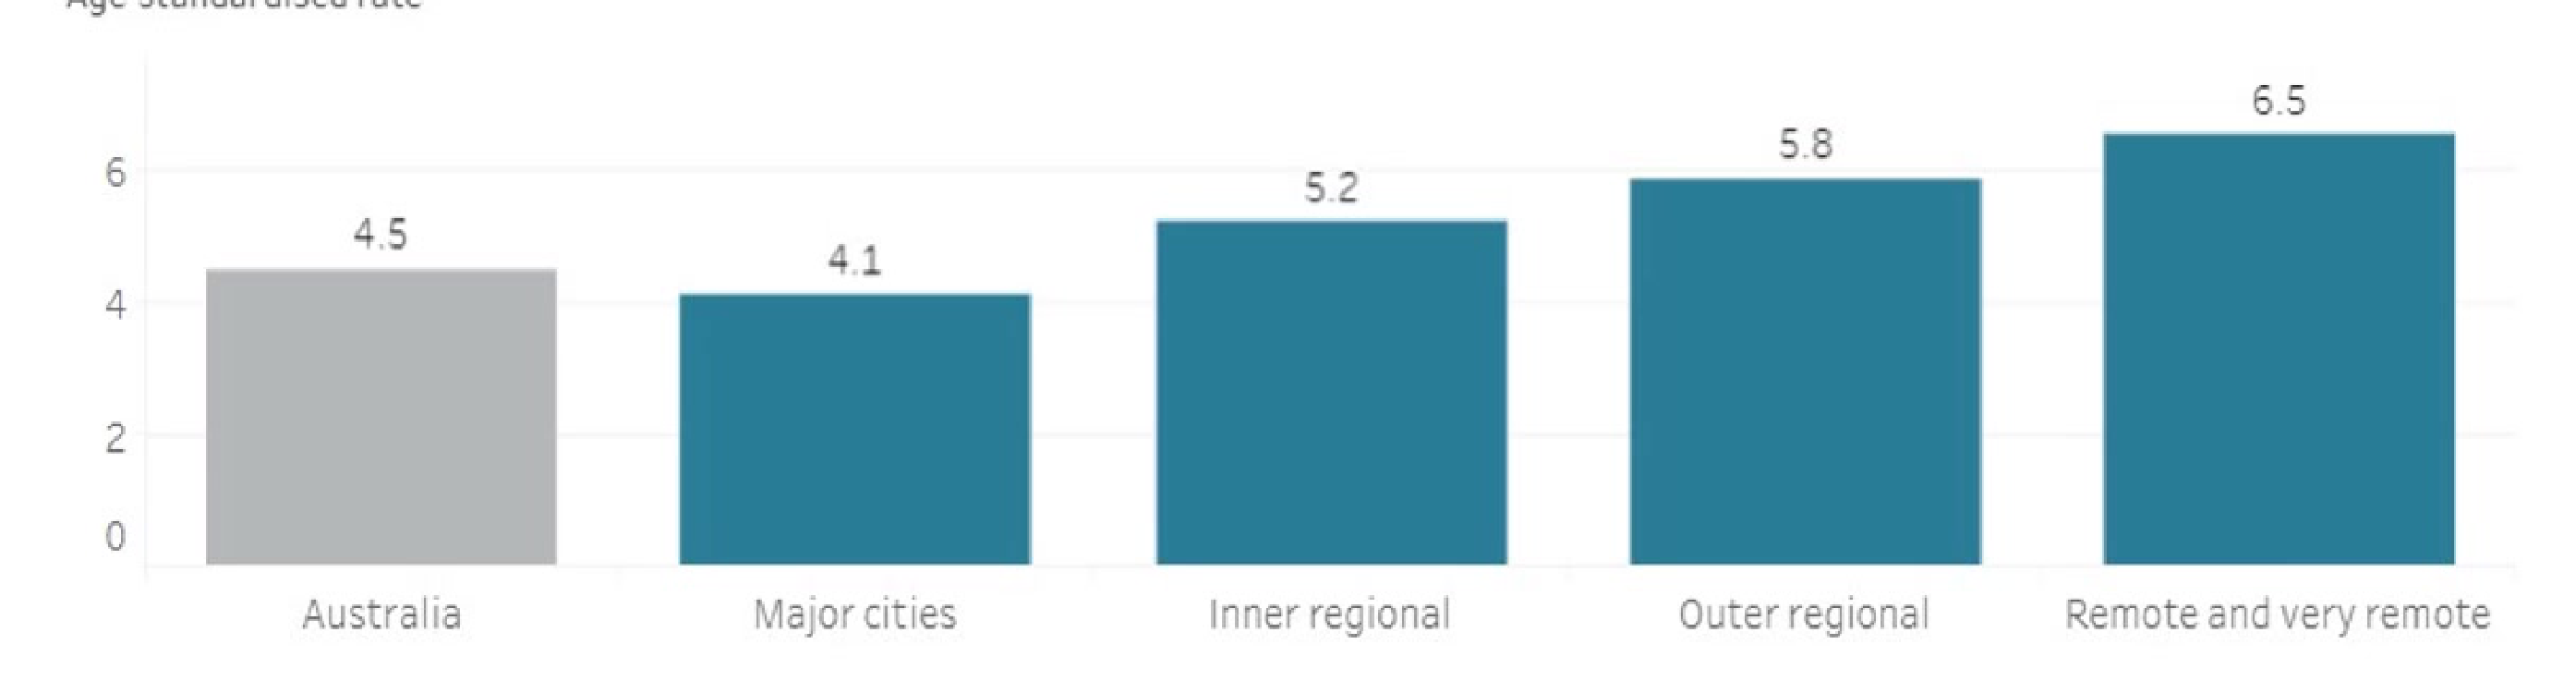
The DALY rate in Remote and very remote areas was 1.6 times as high as in Major Cities.
-
34.9% of the burden in Remote and very remote areas could have been avoided.
-
DALY rates for lip and oral cavity cancer were described as nearly 50% higher than the national average in rural and remote areas.
Oral Disease Burden by Remoteness Area (DALY Rate)
- Australia (Average): 4.5
- Major cities: 4.1
- Inner regional: 5.2
- Outer regional: 5.8
- Remote and very remote: 6.5
Australian Institute of Health and Welfare (2021) Australian Burden of Disease Study 2018: Interactive data on disease burden, AIHW, Australian Government, accessed 28 July 2024.
Age-Standardised DALY Rates By Remoteness Area
Comparison of age-standardised DALY rate by disease: Persons, 2018.
| Disease group | Disease/Injury | Australia | Major cities | Inner regional | Outer regional | Remote and very remote |
|---|---|---|---|---|---|---|
| Oral disorders | Dental caries | 2.0 | 1.8 | 2.4 | 2.6 | 3.0 |
| Periodontal disease | 1.6 | 1.5 | 1.6 | 2.1 | 3.0 | |
| Severe tooth loss | 0.9 | 0.9 | 1.2 | 1.1 | 0.6 | |
| Other oral disorders | 0.0 | 0.0 | 0.0 | 0.0 | 0.0 | |
| Lip and oral cavity cancer | 0.4 | 0.3 | 0.4 | 0.6 | 0.7 |
Rate Difference Legend (Compared to National Average)5
- Lower than national
- <10% greater
- 10–19% greater
- 20–29% greater
- 30–39% greater
- 50%+ greater
- No difference
Australian Institute of Health and Welfare (2021) Australian Burden of Disease Study 2018: Interactive data on disease burden, AIHW, Australian Government, accessed 28 July 2024.

Priority Populations With Additional Oral Care Needs6
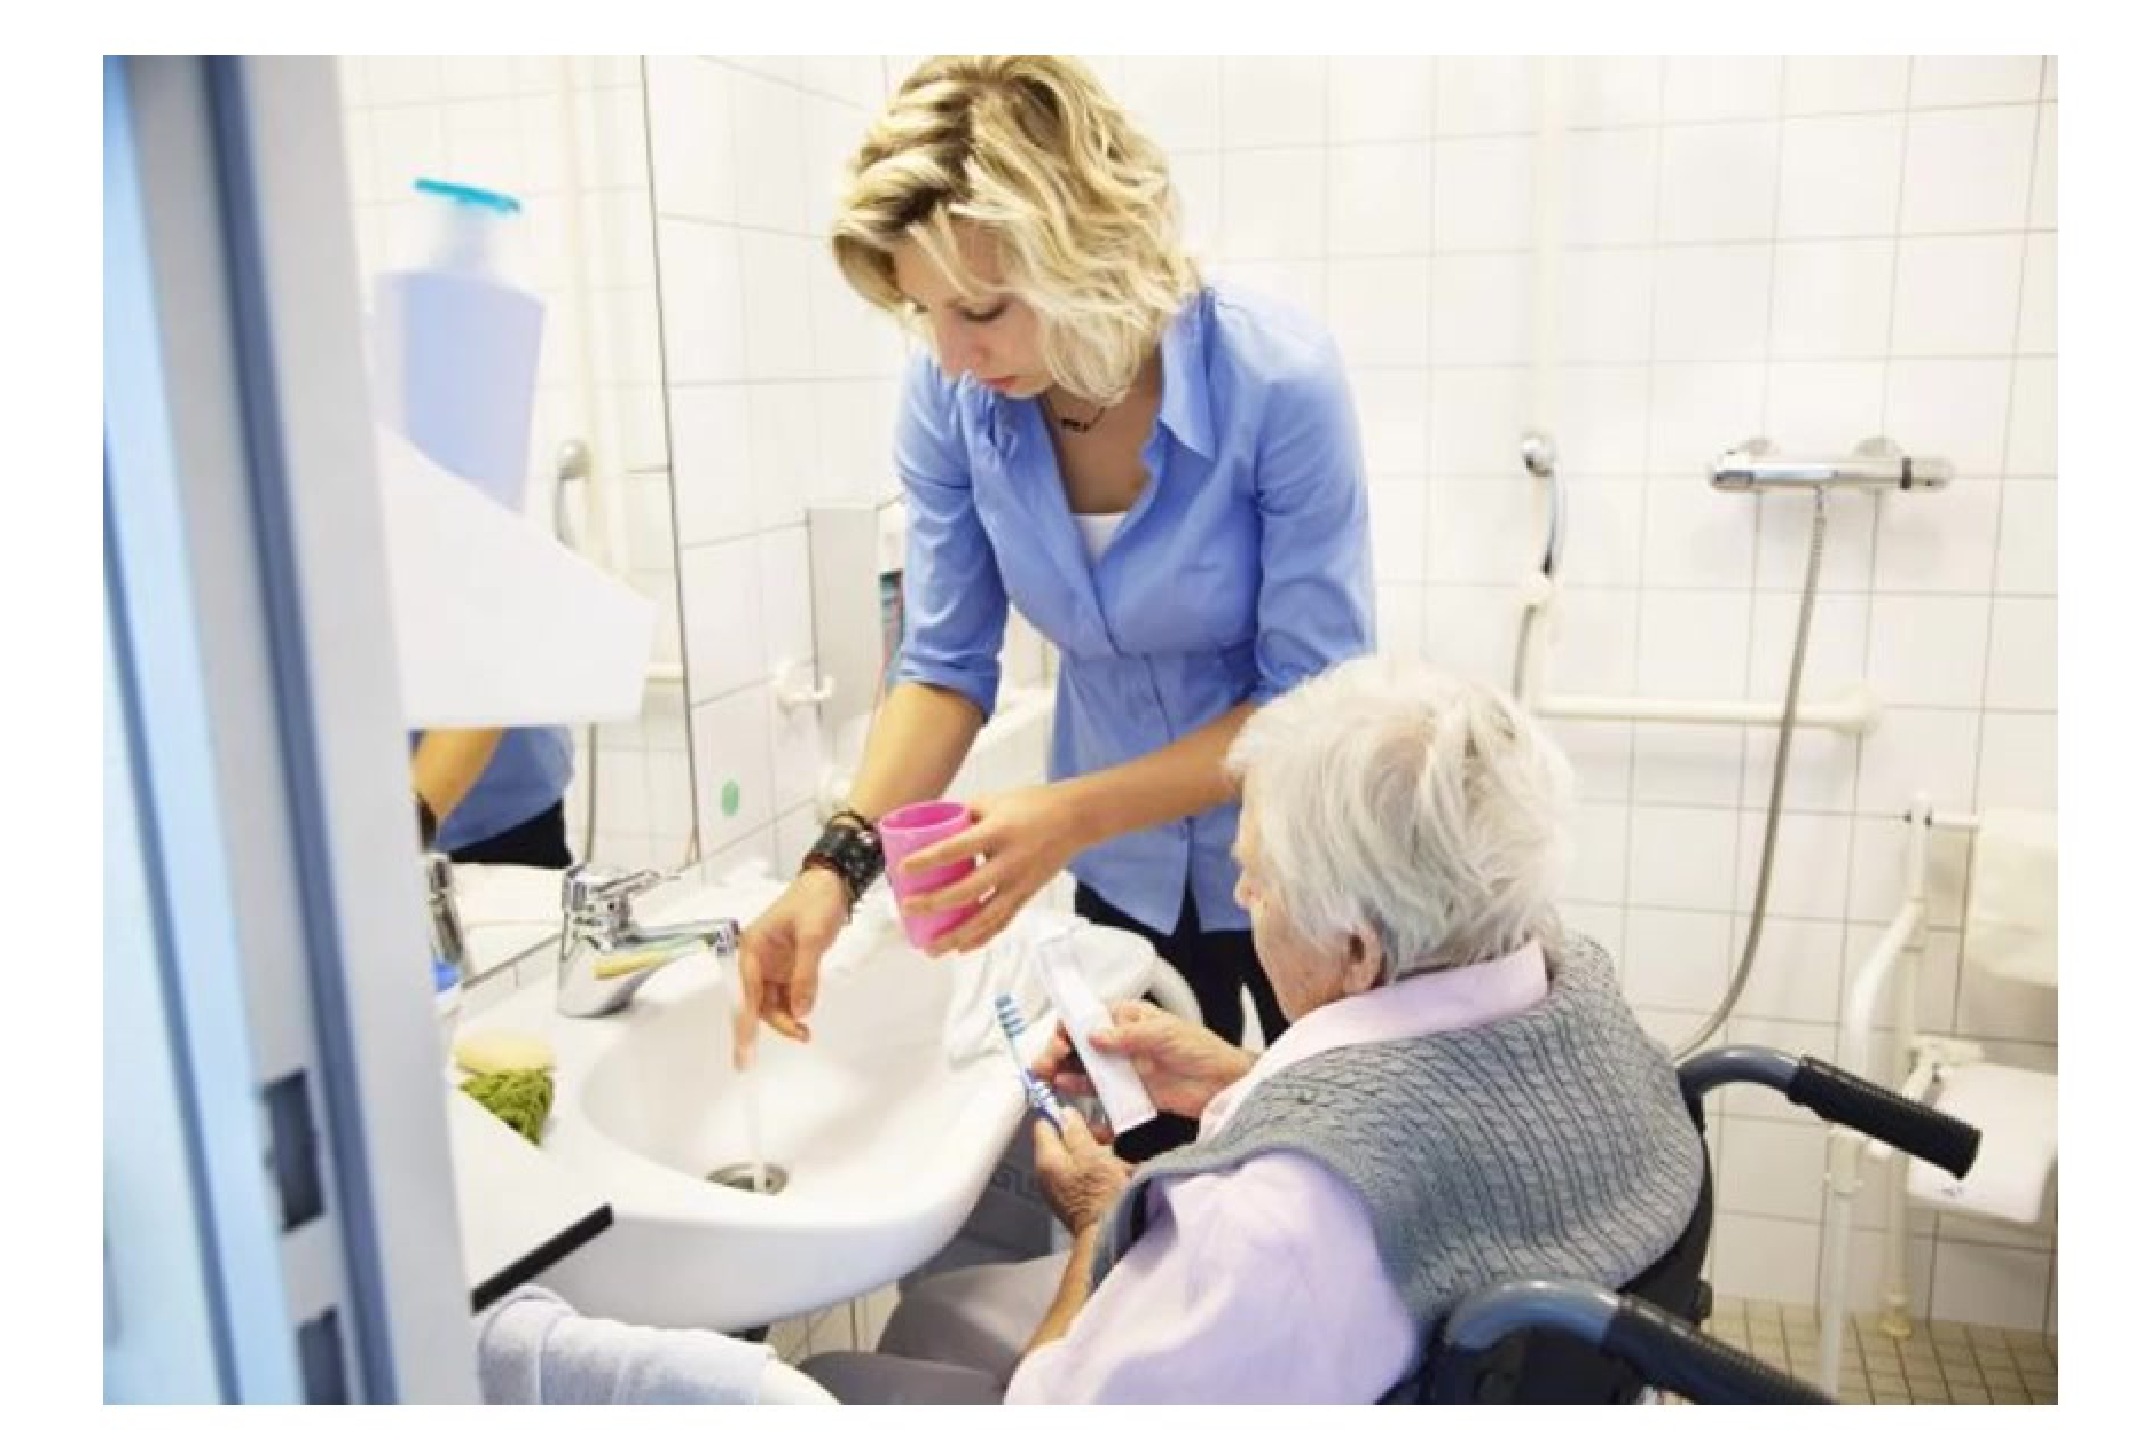
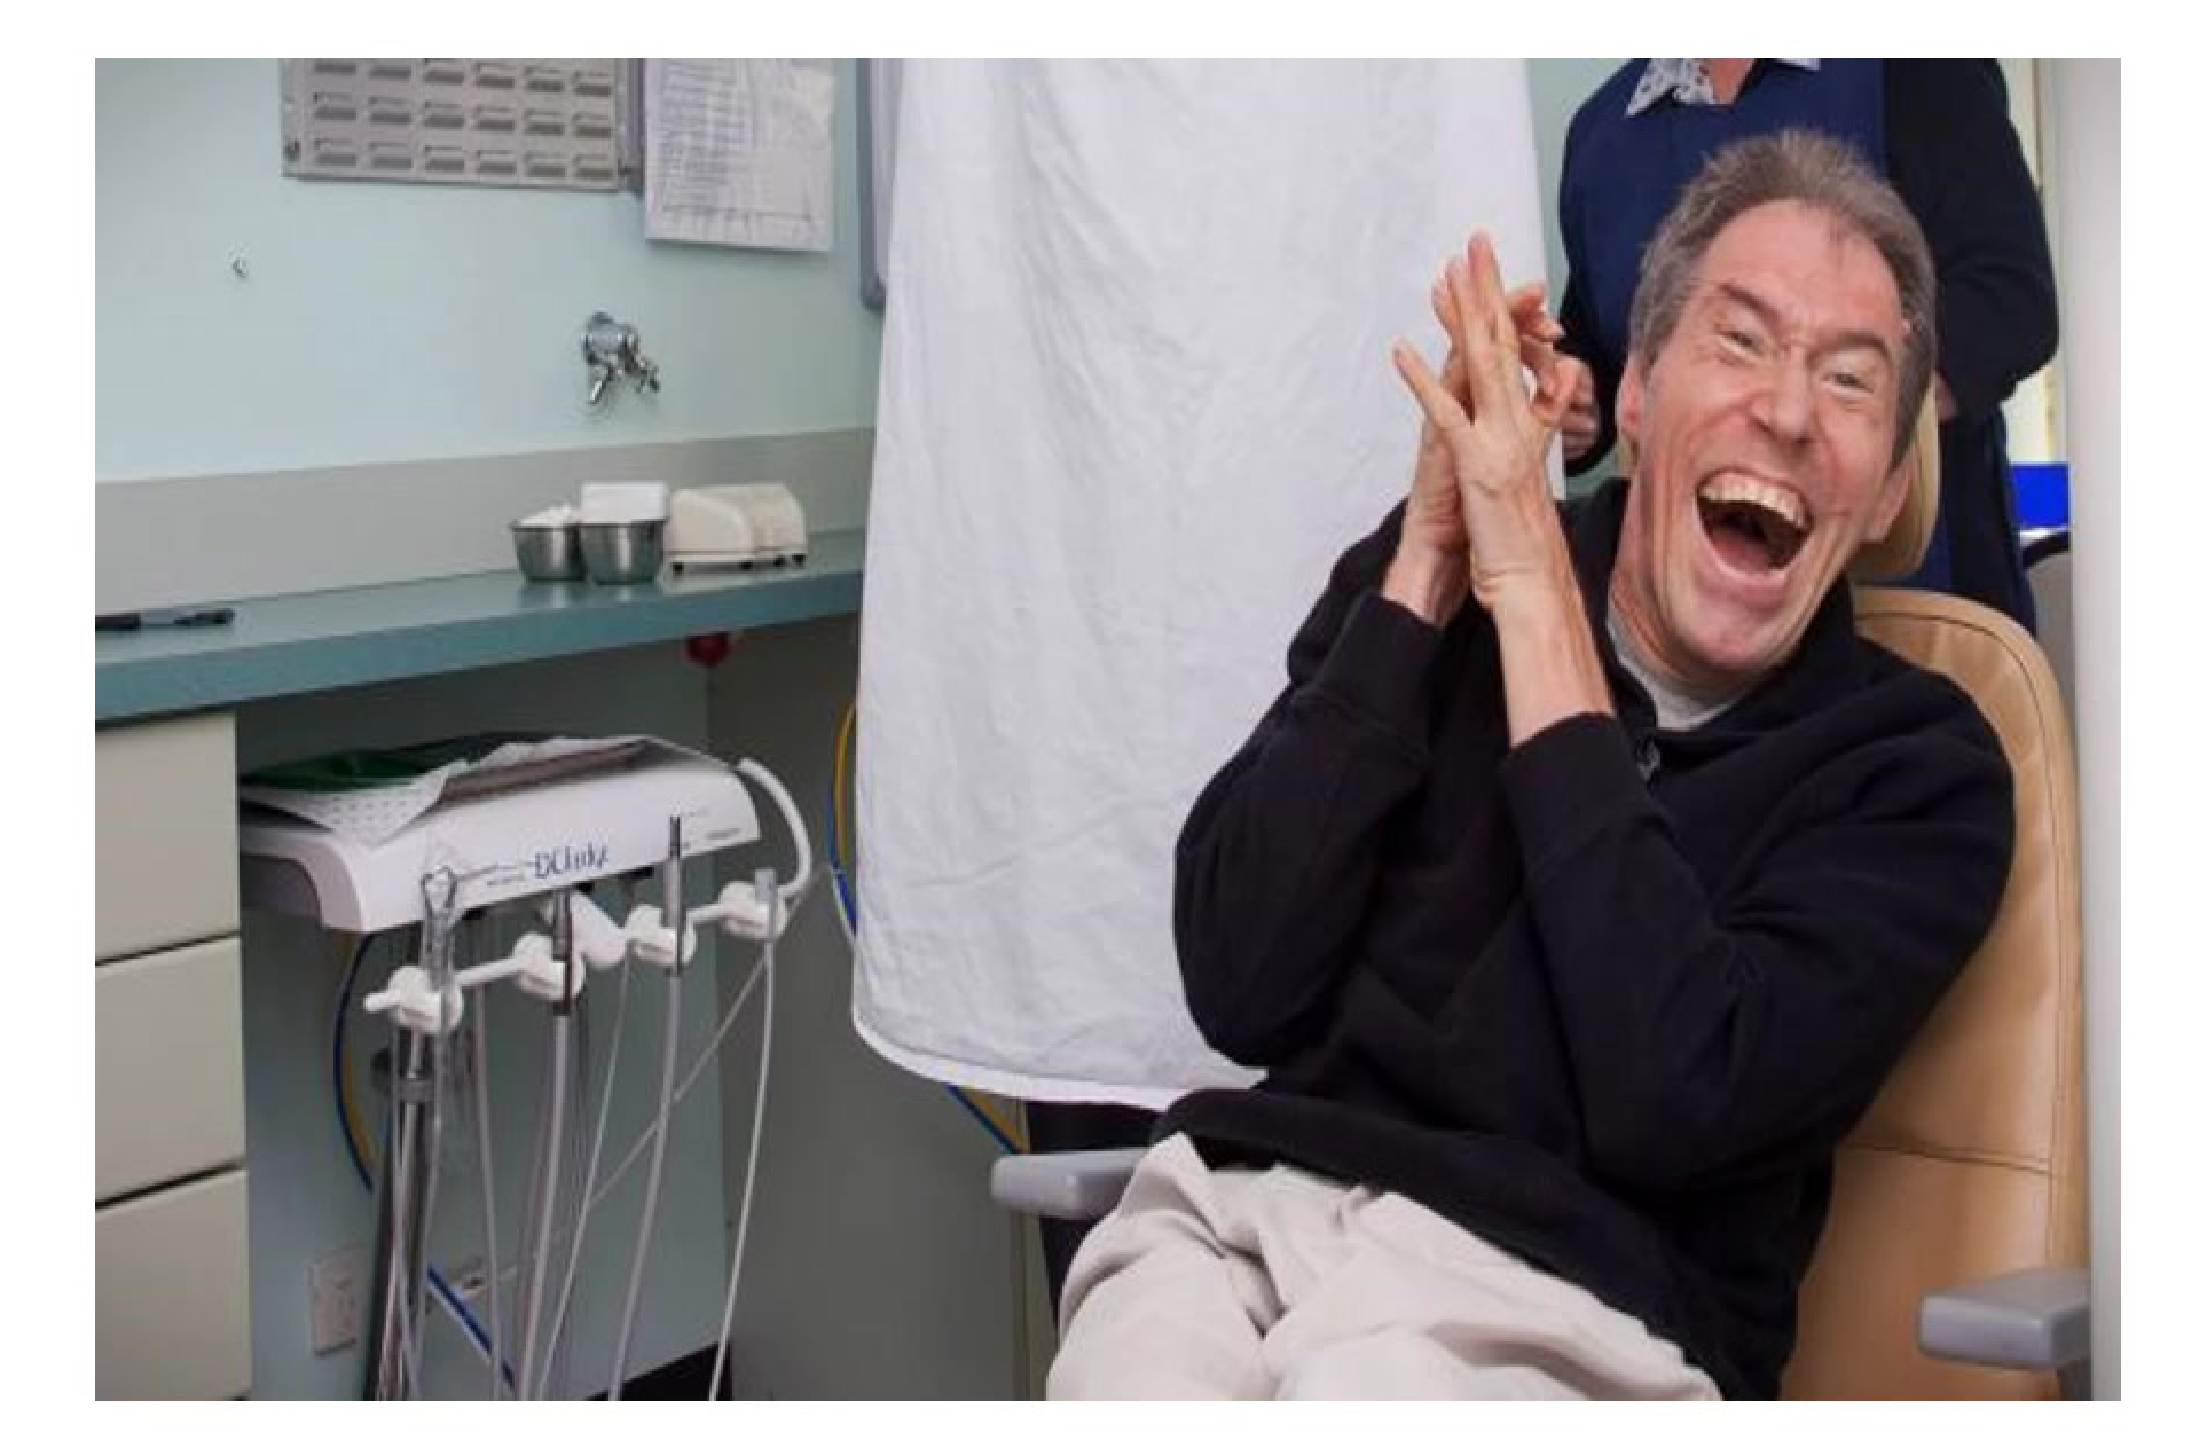
People with additional and/or specialised oral care needs
- https://www.australianageingagenda.com.au/contributors/opinion/stop-the-rot-in-oral-care-for-elderly-australians/
- https://www.dental.wa.gov.au/Dental-Services/Special-services/
 |  |
Composition Of Priority Populations And Related Challenges7
| Priority Population | Challenge to oral care/service |
|---|---|
| People living with mental illness | 1. Live in unstable accommodation (severe illness) 2. A lifestyle that contributes to co-morbidities. 3. Multiple risk factors for poor oral health, including mouth dryness. 4. Increased risk of excessive alcohol consumption, drug use and smoking. |
| People with disabilities | 1. May not perceive or express the need for oral health care. 2. Ambivalent attitudes of disability carers. 3. Costs: Disability schemes do not cover most dental care |
| People with complex medical conditions | 1. Complex needs requiring specialist services. 2. Higher costs of care. |
| Frail old people | 1. Complex needs including dementia. 2. Insufficient oral health resources within aged care settings; 3. Inherent unaddressed structural workforce challenges related to policy, staffing models, changing workforce demographics, and workplace culture, 4. Inadequate access to oral care services (waitlist). |
Australian Institute of Health and Welfare (2023) Oral health and dental care in Australia, AIHW, Australian Government, accessed 15 January 2024.
Lecturer — Additional Population Details
The lecturer added further detail about the composition and practical challenges of these priority populations.
- The four groups include frail older people, who are often living in residential aged care.
- Medications used to manage mental illnesses can contribute to additional health challenges.
- Some, or most, people with disabilities may be entirely dependent on disability carers or other carers, and people living in institutionalised care may be particularly affected by ambivalent attitudes among those carers.
- People with disabilities often have complex oral care needs, and specialist services may involve very long waiting lists.
- Aged care workers may come from multicultural and migrant communities and may have ambivalent attitudes towards oral health.
- There may be long waiting lists when accessing public services, particularly specialist care.
Findings For The Elder Population89
ARCPOH: https://health.adelaide.edu.au/arcpoh/ua/media/821/australias-oral-health-2017-18.pdf
Edentulism Trends From National Oral Health Surveys
Percentage with Fewer Than 21 Natural Teeth10
| Survey Year | 15–24 | 25–34 | 35–44 | 45–54 | 55–64 | 65–74 | 75+ | All ages |
|---|---|---|---|---|---|---|---|---|
| 1987–88 | 0.5 | 5.0 | 16.6 | 32.7 | 53.5 | 72.1 | 79.8 | 20.6 |
| 2004–06 | 0.1 | 0.4 | 2.5 | 10.5 | 24.9 | 43.7 | 55.6 | 13.8 |
| 2017–18 | 0.7 | 0.7 | 3.0 | 6.8 | 17.4 | 28.9 | 45.6 | 10.2 |
Source: National Oral Health Survey of Australia 1987–88, National Survey of Adult Oral Health from 2004–06, and National Study of Adult Oral Health 2017–18.
ARCPOH: https://health.adelaide.edu.au/arcpoh/ua/media/821/australias-oral-health-2017-18.pdf
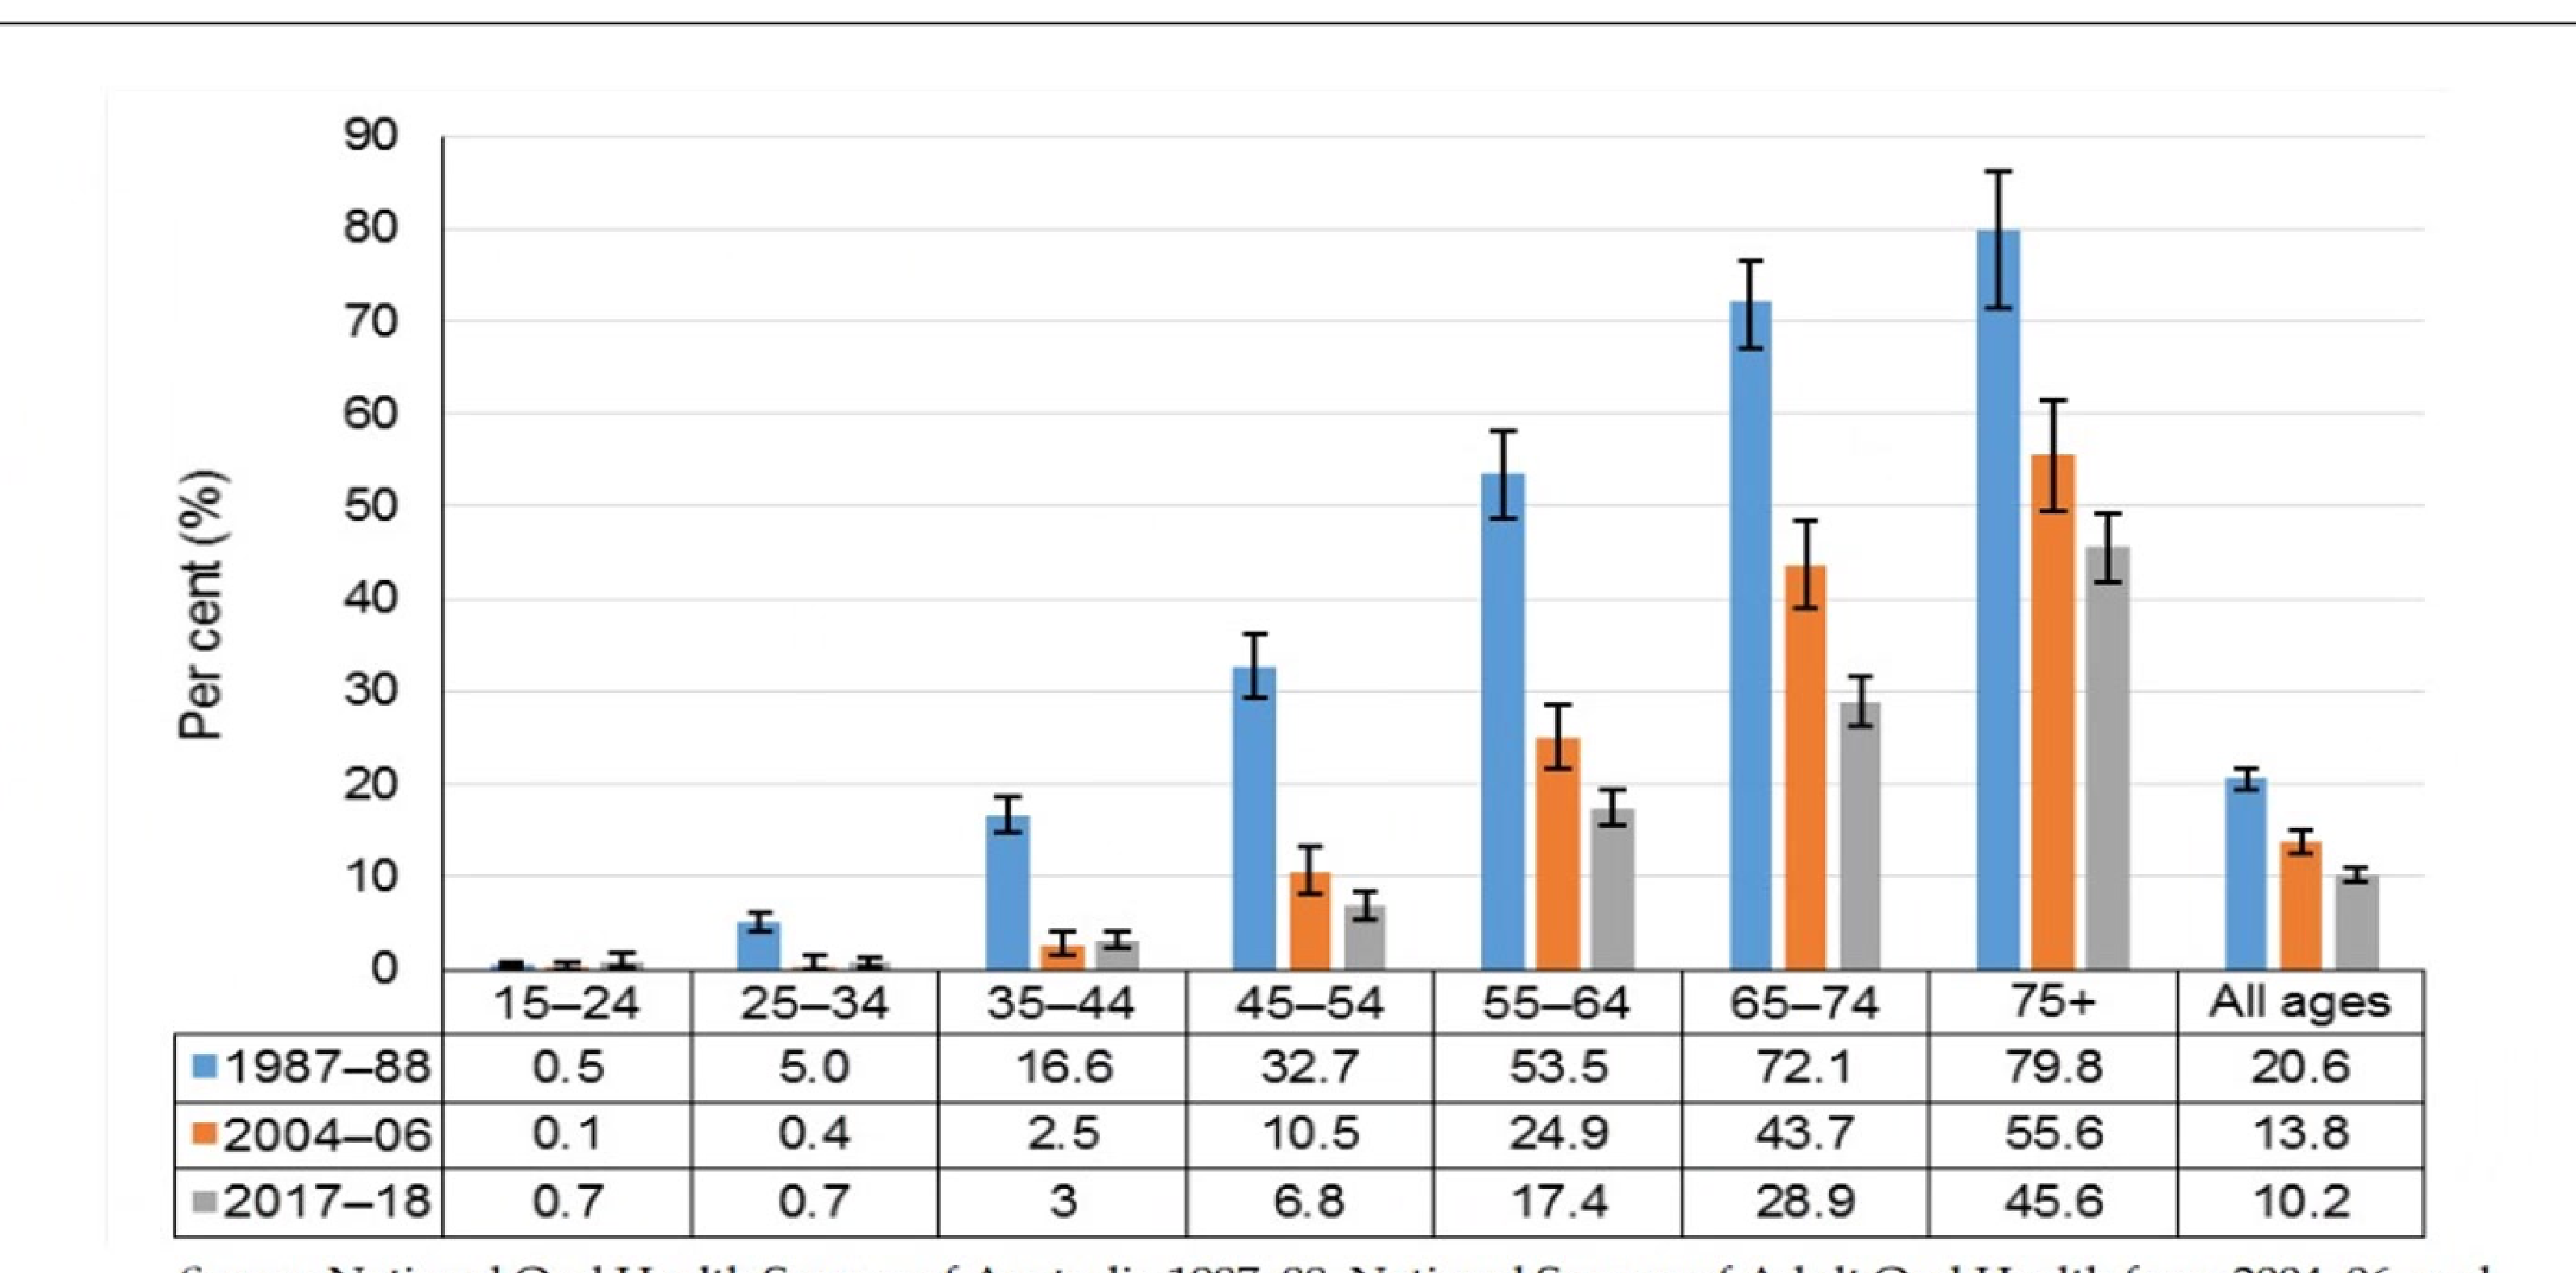
Percentage Wearing Denture(s)11
| Survey Year | 15–24 | 25–34 | 35–44 | 45–54 | 55–64 | 65–74 | 75+ | All ages |
|---|---|---|---|---|---|---|---|---|
| 1987–88 | 1.3 | 6.5 | 19.7 | 34.8 | 52.5 | 65.0 | 78.0 | 21.5 |
| 2004–06 | 0.5 | 2.4 | 5.5 | 15.6 | 29.2 | 48.0 | 61.2 | 14.9 |
| 2017–18 | 0.8 | 1.3 | 3.8 | 7.9 | 19.1 | 32.1 | 47.4 | 11.3 |
Figure 7.3: The percentage of people wearing denture(s) among dentate Australians aged 15 years and over, 1987–88, 2004–06, and 2017–18
Source: National Oral Health Survey of Australia 1987–88, National Survey of Adult Oral Health 2004–06, and National Study of Adult Oral Health 2017–18.
ARCPOH: https://health.adelaide.edu.au/arcpoh/ua/media/821/australias-oral-health-2017-18.pdf
Lecturer — Elder Trends
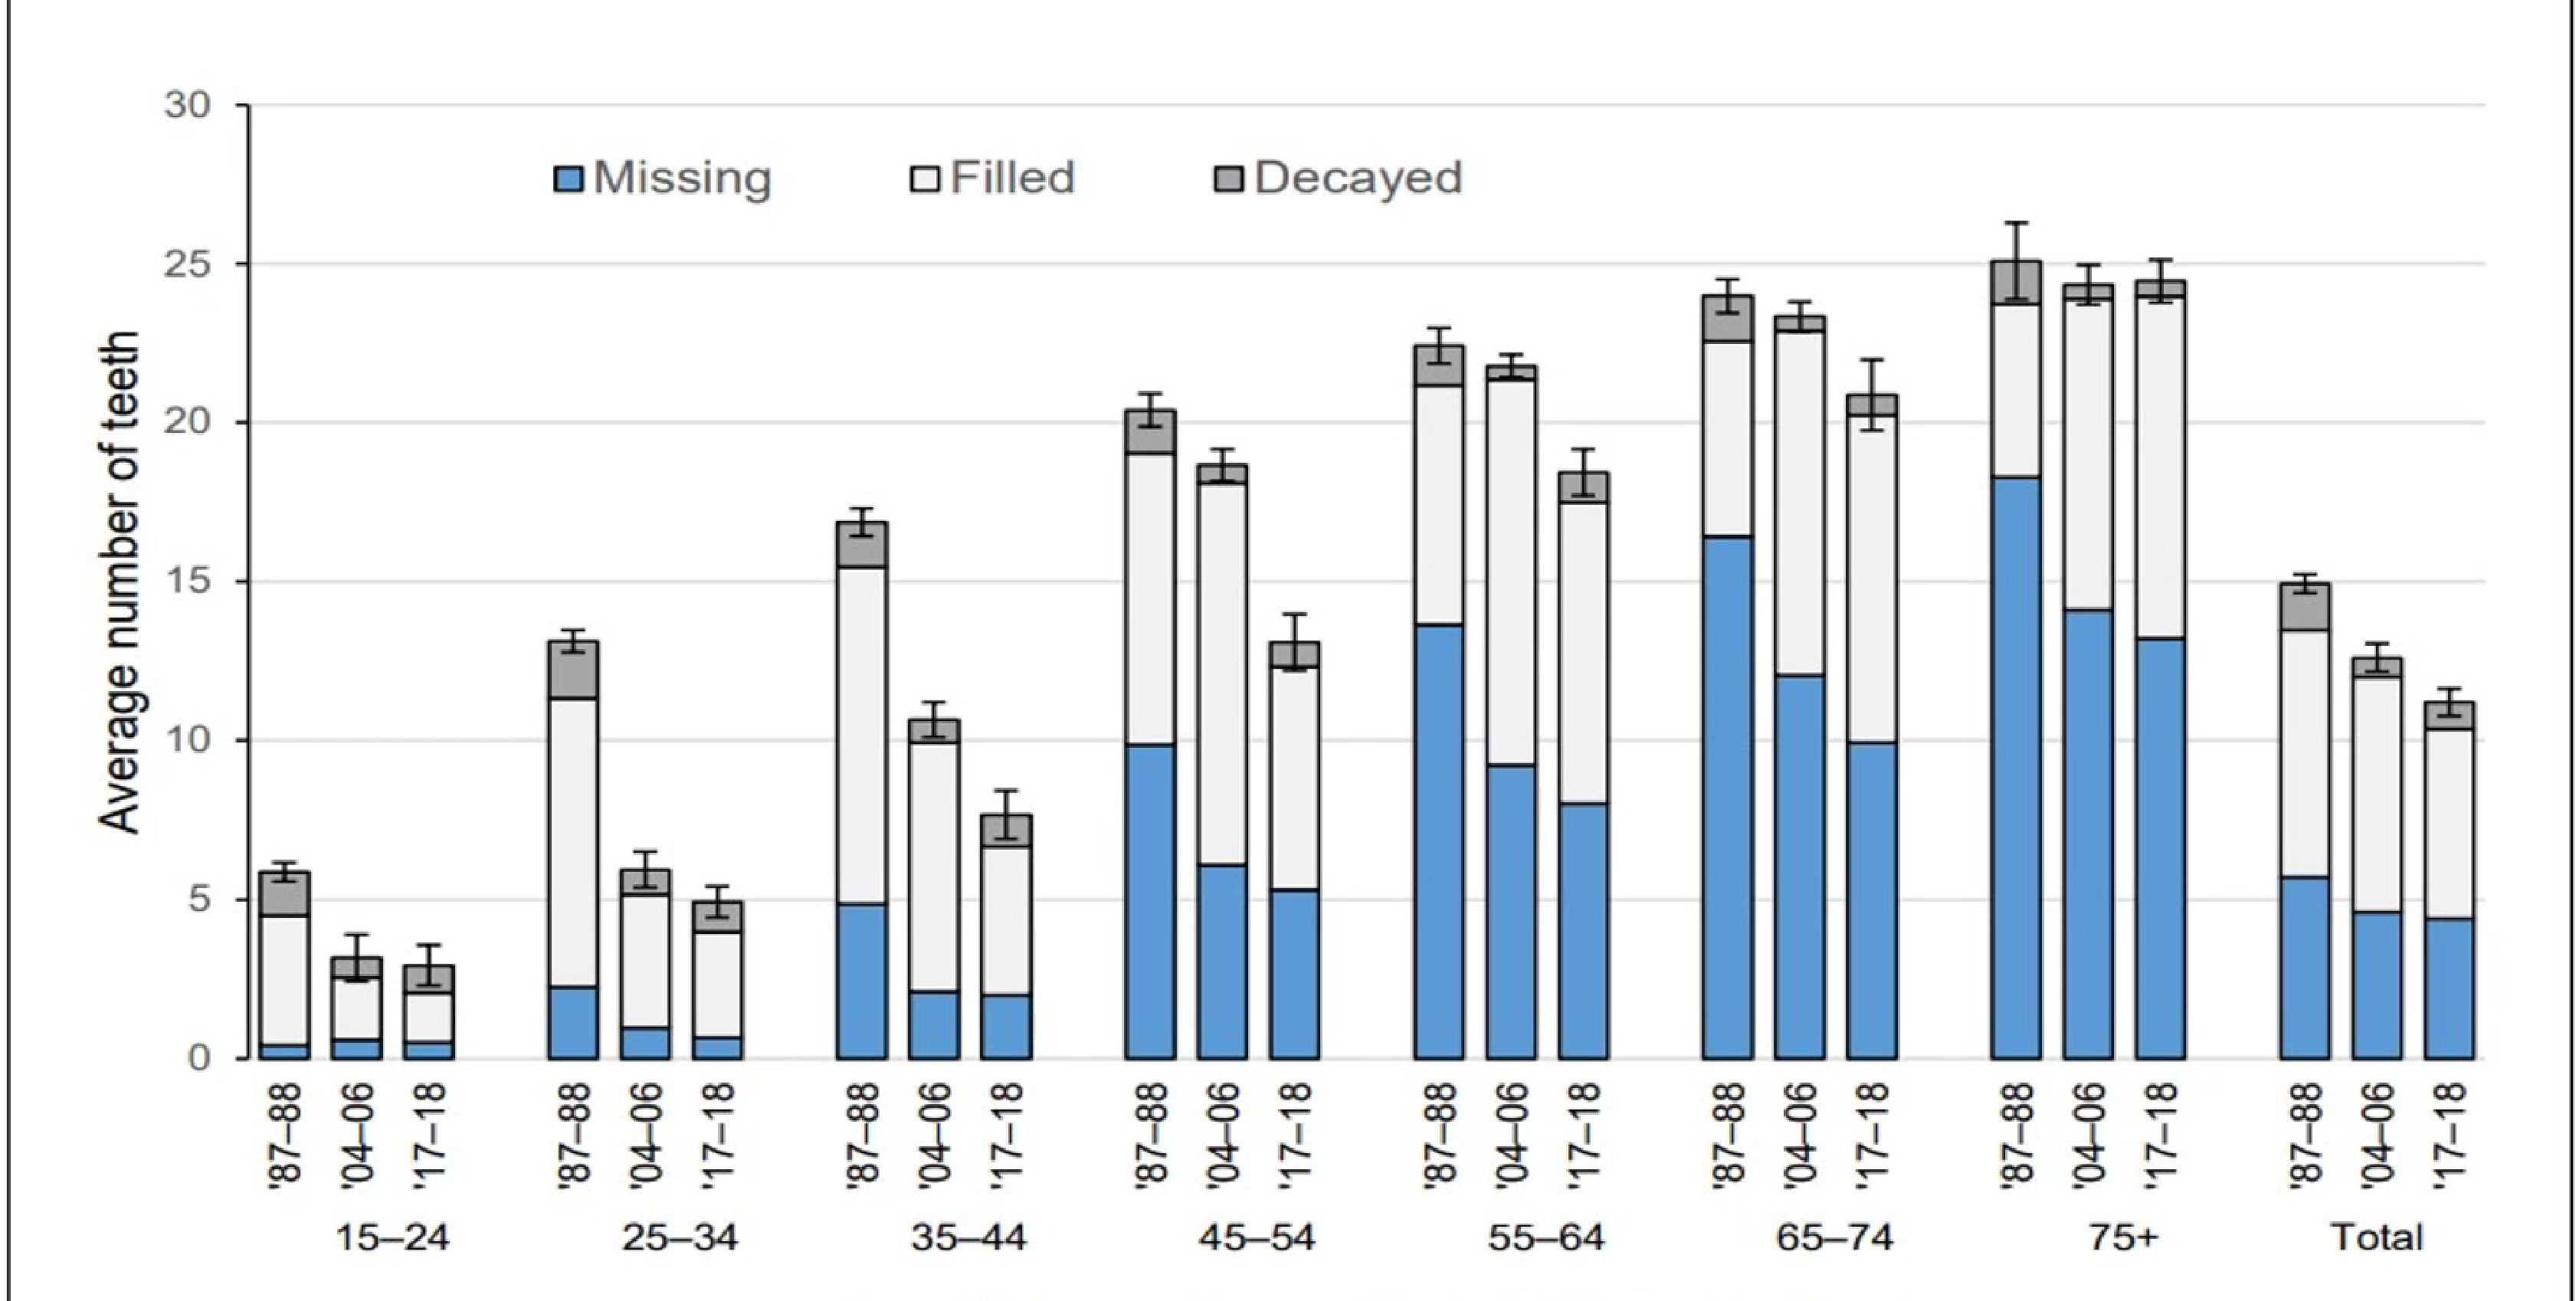
Older people were expected to have higher DMF values because they have lived longer and therefore have greater lifetime caries experience.
- The decline in tooth loss was presented as an indication that treatment of the dentition may be improving.
- As older people retain more teeth, periodontal disease findings would be expected to be substantially higher.
- The decline in denture use was linked to the reduction in tooth loss.
- No specific burden-of-disease findings were available for this population group, so the lecture referred to the 2017–18 National Oral Health Survey.
Findings For People With Disabilities
Lecturer — Population Data
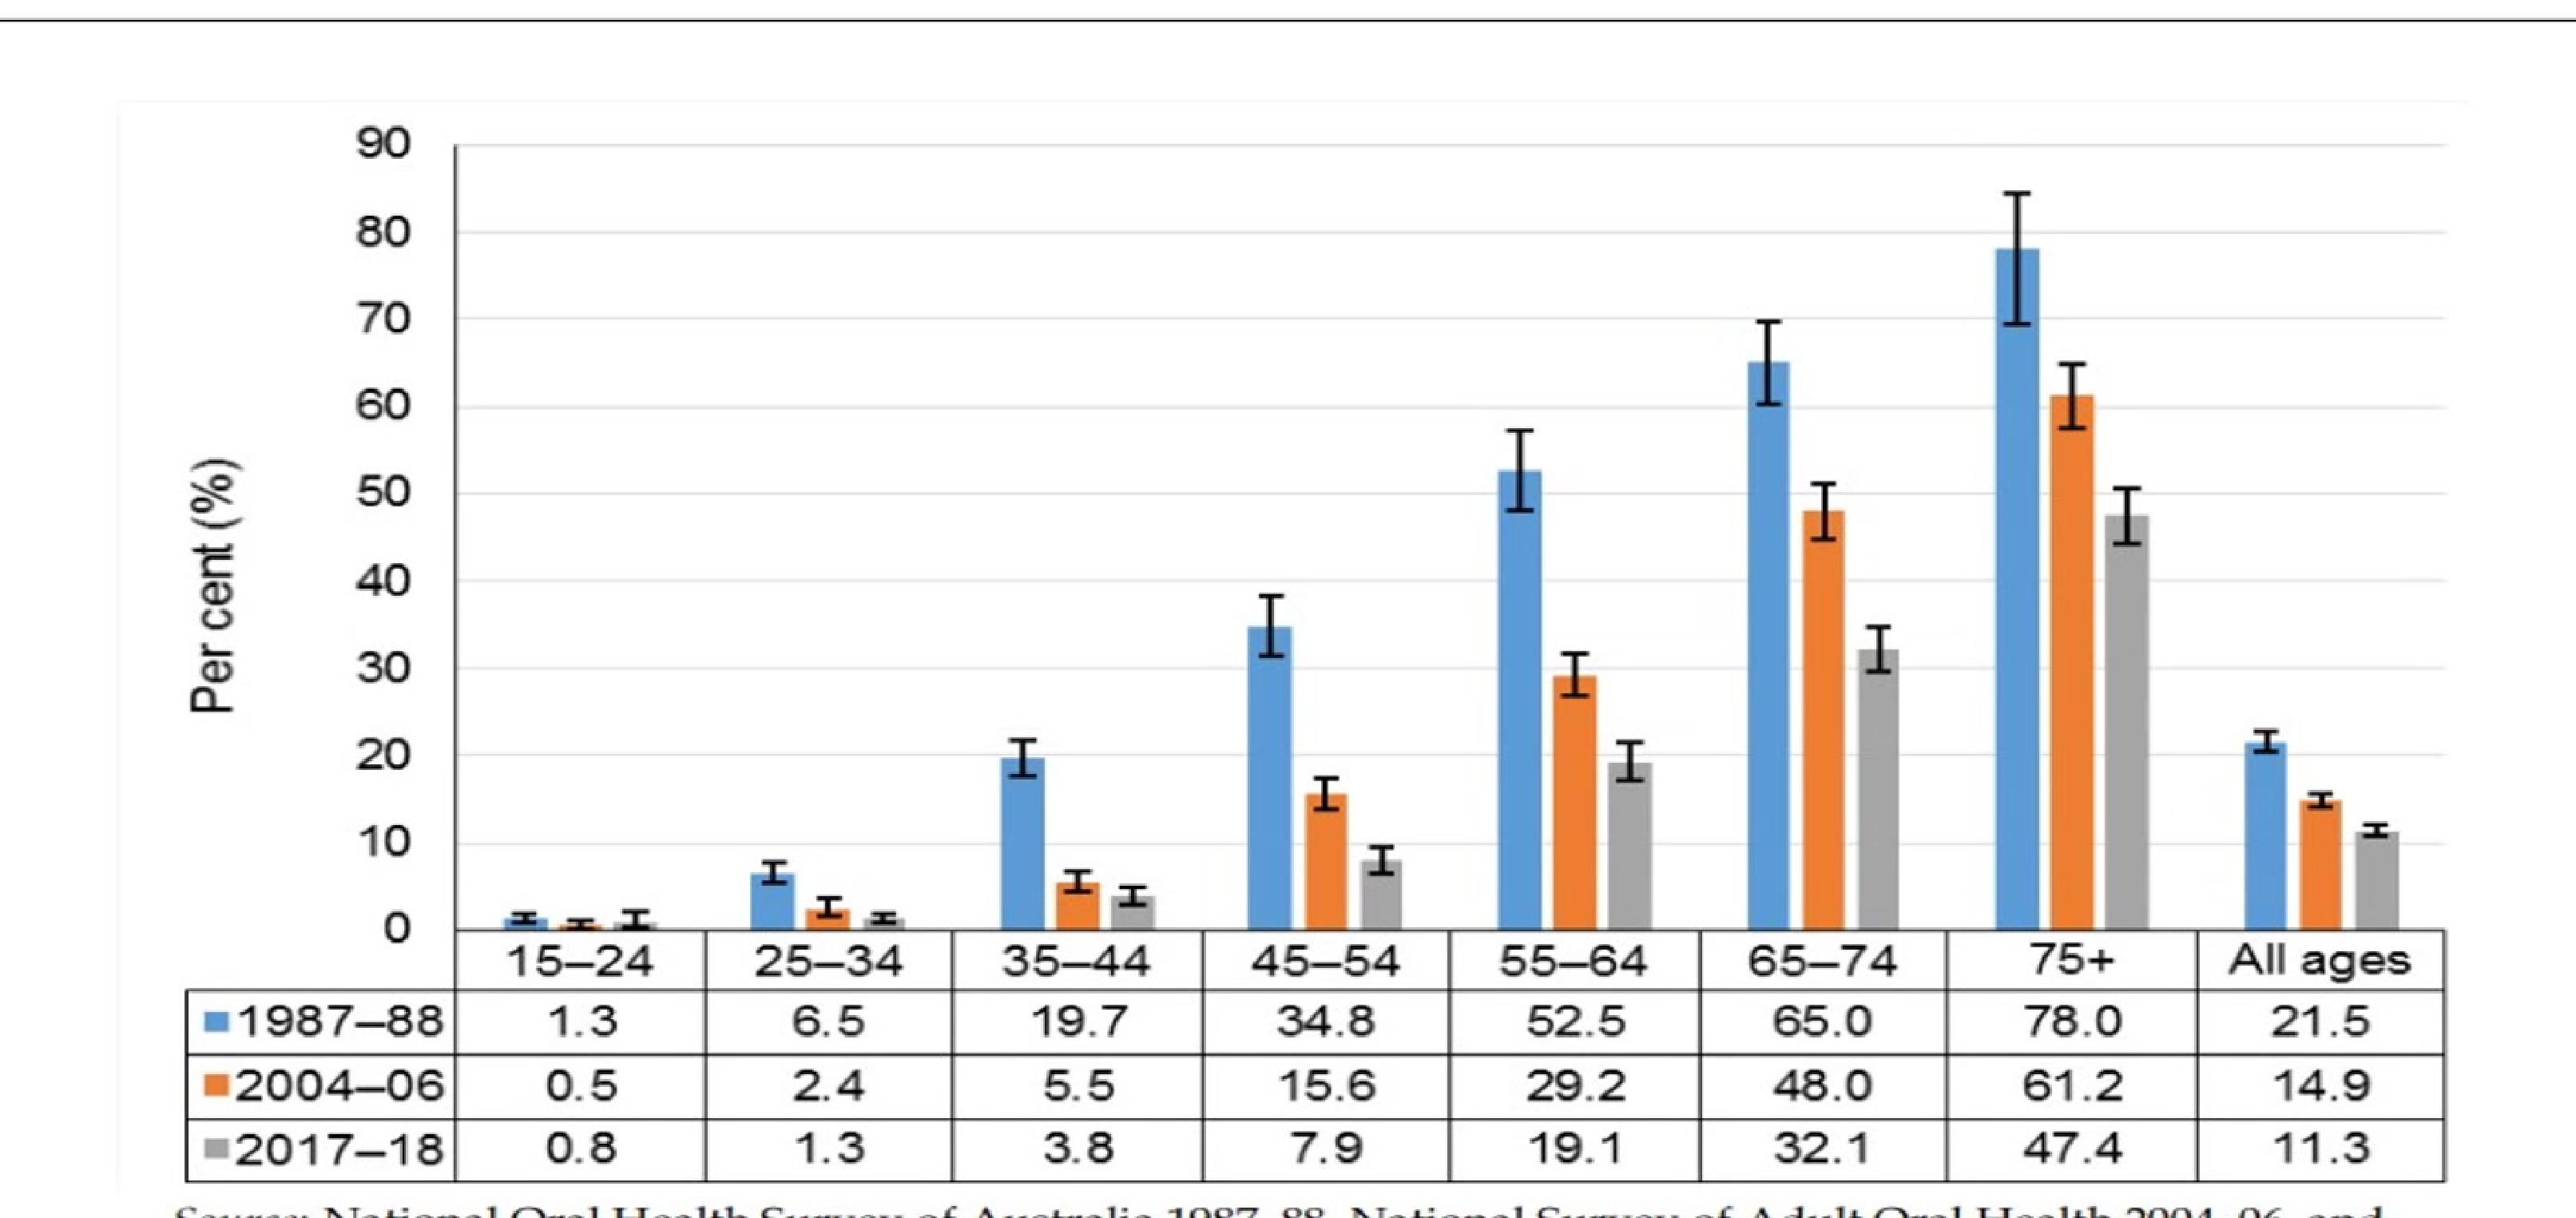
There is no substantive population-level data on oral health disease burden among people with disabilities. Research studies are therefore used to help identify their oral health needs.
Distribution of Children by Dental Status and Treatment Needs12
| Dental Status | Children at Special Developmental Schools (n=150) Range | Children at Special Developmental Schools (n=150) Mean (±SD) | Children at Special Schools (n=150) Range | Children at Special Schools (n=150) Mean (±SD) | Total Children (n=300) Range | Total Children (n=300) Mean (±SD) |
|---|---|---|---|---|---|---|
| No. decayed teeth (d+D) | 0–16 | 1.5 (2.4) | 0–8 | 1.3 (1.6) | 0–16 | 1.4 (2.0) |
| No. missing teeth (m+M) | 0–2 | 0.1 (0.3) | 0–2 | 0.1 (0.3) | 0–2 | 0.1 (0.3) |
| No. filled teeth (f+F) | 0–8 | 0.9 (1.7) | 0–8 | 0.7 (1.4) | 0–8 | 0.8 (1.6) |
| Total No. teeth present (t+T) | 17–29 | 24.0 (2.0) | 14–31 | 24.6 (2.3) | 14–31 | 24.3 (2.2) |
| dmft + DMFT index* | 0–18 | 2.5 (3.1) | 1–10 | 2.0 (2.3) | 0–18 | 2.2 (2.8) |
| No. teeth with enamel defects | 0–18 | 1.2 (2.8) | 0–26 | 2.2 (4.1) | 0–26 | 1.7 (3.5) |
| No. teeth with attrition | 0–22 | 3.1 (5.1) | 0–16 | 2.1 (4.1) | 0–22 | 2.6 (4.6) |
*dmft+DMFT index = sum of No. of decayed teeth (d+D), plus No. of missing teeth (m+M), plus No. of filled teeth (f+F).
| Need for Preventive and/or Restorative Treatment | Special Developmental Schools No. (%) | Special Schools No. (%) | Total Children No. (%) |
|---|---|---|---|
| None | 18 (12%) | 8 (5%) | 26 (9%) |
| Simple | 66 (44%) | 57 (38%) | 123 (41%) |
| Moderate | 38 (25%) | 53 (35%) | 91 (30%) |
| Complex | 28 (19%) | 32 (21%) | 60 (20%) |
Dental Treatment Needs Of Children With Disabilities
Desai M, Messer LB, Calache H. A study of the dental treatment needs of children with disabilities in Melbourne, Australia. Aust Dent J. 2001 Mar;46(1):41-50. doi: 10.1111/j.1834-7819.2001.tb00273.x
Azimi S, Lima F, Slack-Smith L, Bourke J, Calache H, Junaid M, Leonard H. Factors associated with dental hospitalisations in children with intellectual disability or autism spectrum disorder: a Western Australian population-based retrospective cohort study. Disabil Rehabil. 2022 Sep;44(19):5495-5503. doi: 10.1080/09638288.2021.1936662.
Australian Institute of Health and Welfare (2023) Oral health and dental care in Australia, AIHW, Australian Government, accessed 28 July 2024. https://www.aihw.gov.au/reports/dental-oral-health/oral-health-and-dental-care-in-australia/contents/priority-populations/people-with-additional-and-or-specialised-health-c
Oral Hospitalisation And Intellectual Disability13
Lecturer — Hospital Admissions
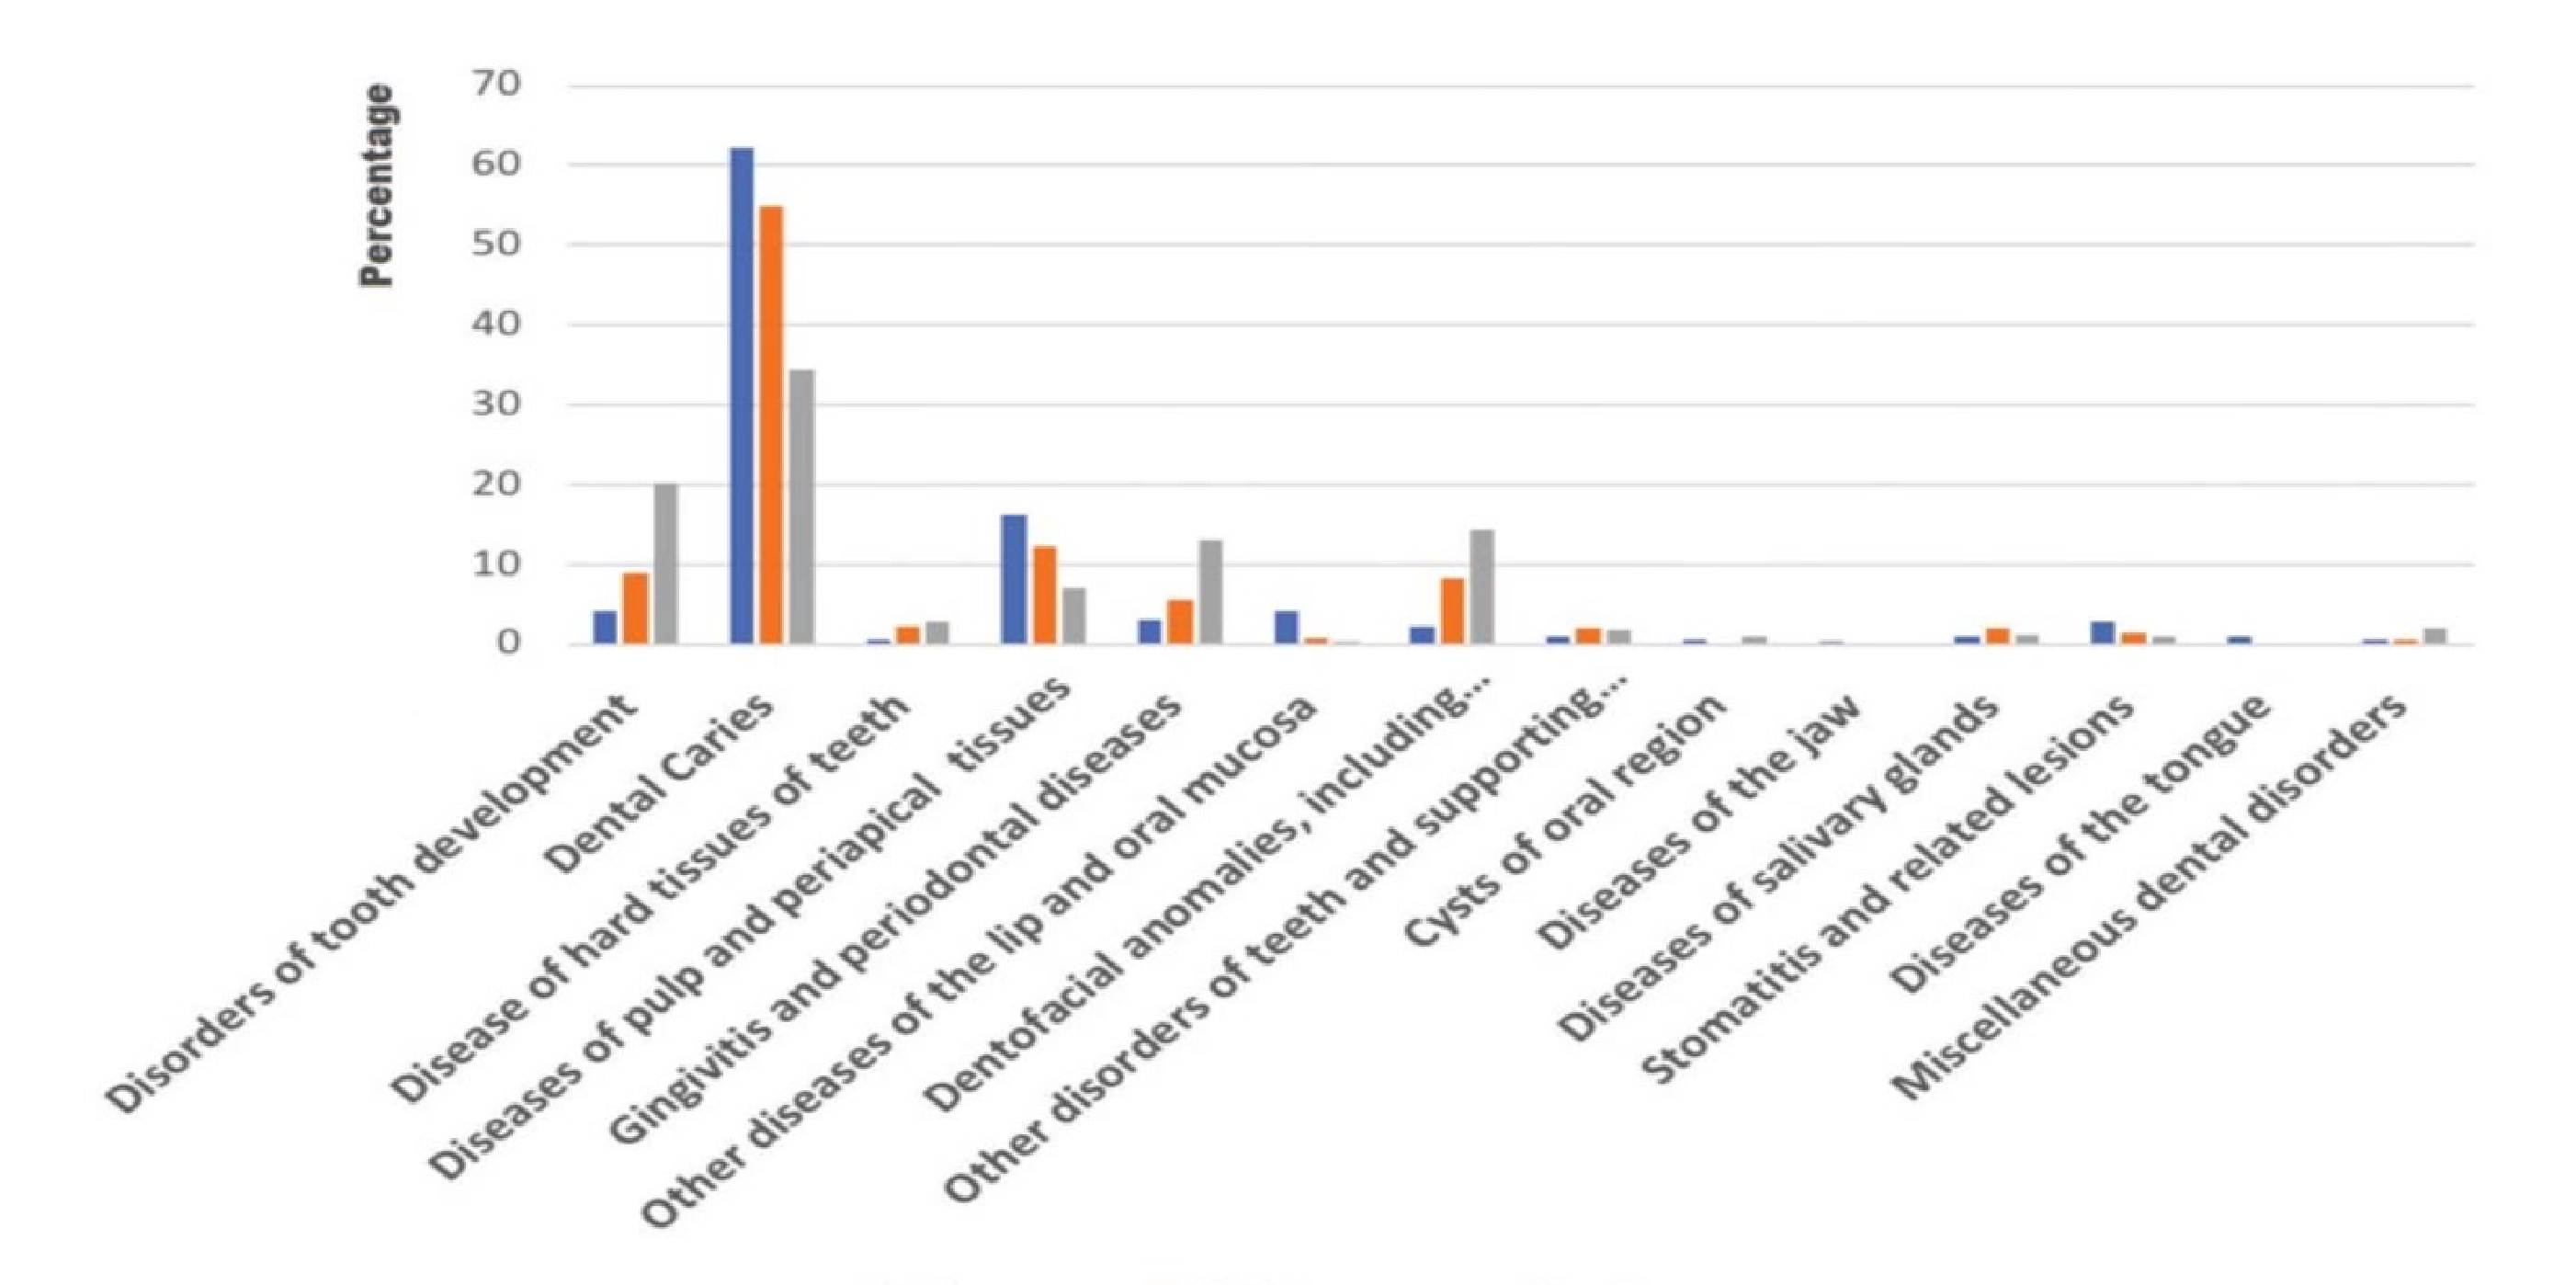
A substantial proportion of children with intellectual disability and autism had been admitted to hospital for dental caries.
- This was concerning because it suggested that these children were not receiving adequate primary oral health care services.
- Hospital use for dental caries indicated gaps in primary oral health care.
- 0–6 years
- 6–12 years
- 12–18 years
Desai M, Messer LB, Calache H. A study of the dental treatment needs of children with disabilities in Melbourne, Australia. Aust Dent J. 2001 Mar;46(1):41-50. doi: 10.1111/j.1834-7819.2001.tb00273.x
Azimi S, Lima F, Slack-Smith L, Bourke J, Calache H, Junaid M, Leonard H. Factors associated with dental hospitalisations in children with intellectual disability or autism spectrum disorder: a Western Australian population-based retrospective cohort study. Disabil Rehabil. 2022 Sep;44(19):5495-5503. doi: 10.1080/09638288.2021.1936662.
Australian Institute of Health and Welfare (2023) Oral health and dental care in Australia, AIHW, Australian Government, accessed 28 July 2024. https://www.aihw.gov.au/reports/dental-oral-health/oral-health-and-dental-care-in-australia/contents/priority-populations/people-with-additional-and-or-specialised-health-c
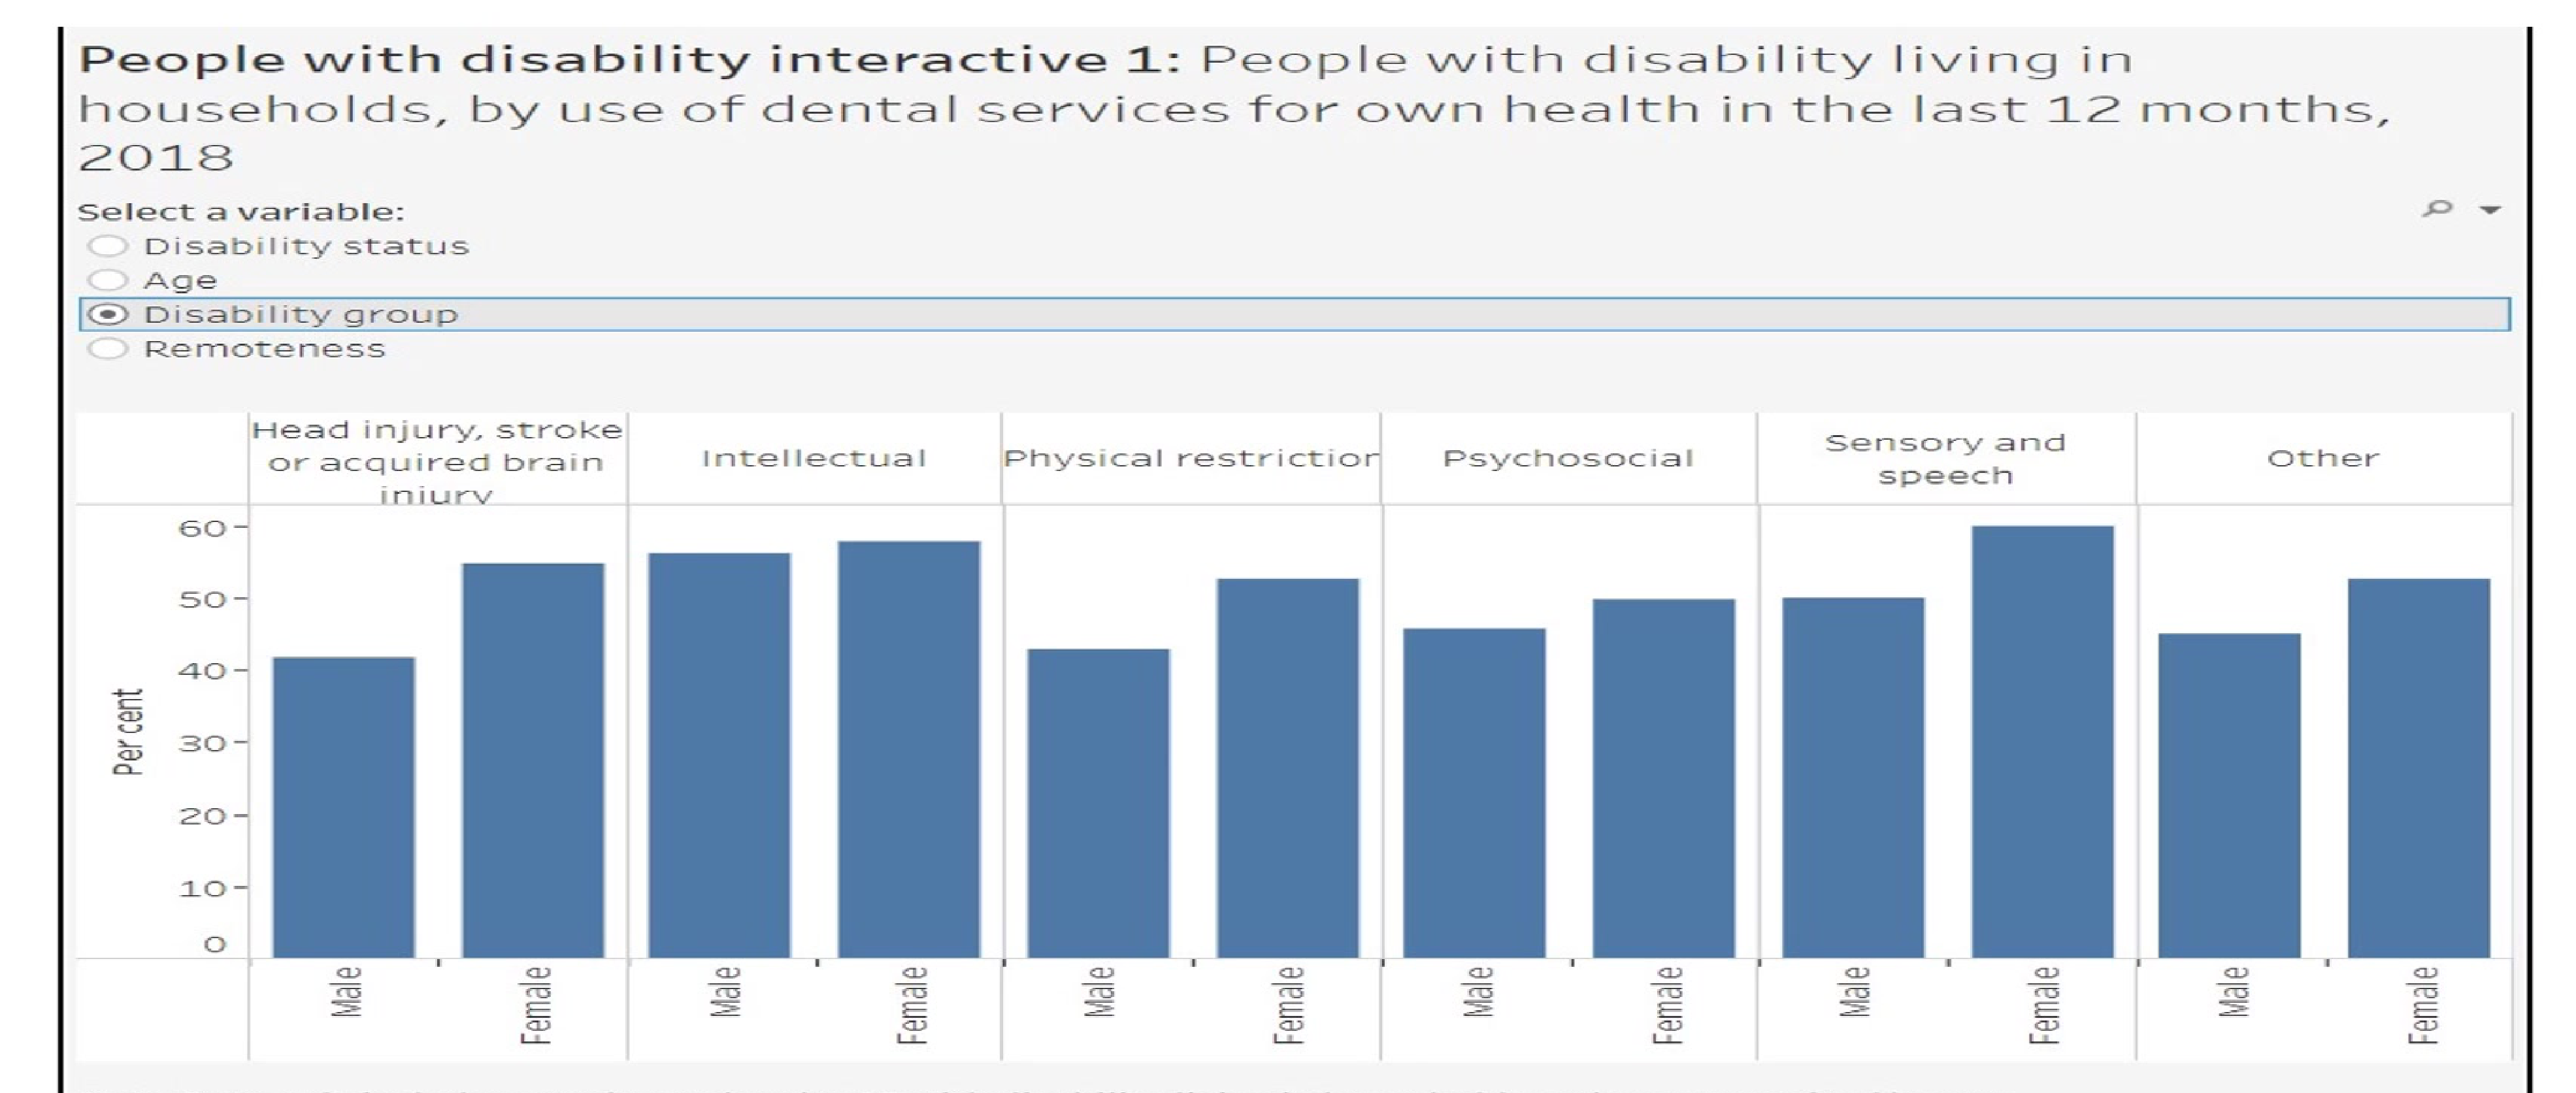
Dental Service Use By People With Disability
Dental Service Utilization by Household Residents (2018)14
People with disability living in households, by use of dental services for own health in the last 12 months, 2018 (Per cent).
Selected variable: Disability group
- Head injury, stroke or acquired brain injury (Male / Female)
- Intellectual (Male / Female)
- Physical restriction (Male / Female)
- Psychosocial (Male / Female)
- Sensory and speech (Male / Female)
- Other (Male / Female)
Other available variables:
- Disability status
- Age
- Remoteness
Note: Data only includes people aged under 65 with disability living in households, unless categorised by age. Source: ABS 2019, http://www.aihw.gov.au
Lecturer — Disability Service Use
People living with disabilities often use more dental services because they have significant dental needs.
- Their service use occurs in the context of complex oral care needs.
- Disability schemes provide limited coverage of dental care.
- Many people depend on carers.
- Specialist services may involve long waiting lists.
Desai M, Messer LB, Calache H. A study of the dental treatment needs of children with disabilities in Melbourne, Australia. Aust Dent J. 2001 Mar;46(1):41-50. doi: 10.1111/j.1834-7819.2001.tb00273.x
Azimi S, Lima F, Slack-Smith L, Bourke J, Calache H, Junaid M, Leonard H. Factors associated with dental hospitalisations in children with intellectual disability or autism spectrum disorder: a Western Australian population-based retrospective cohort study. Disabil Rehabil. 2022 Sep;44(19):5495-5503. doi: 10.1080/09638288.2021.1936662.
Australian Institute of Health and Welfare (2023) Oral health and dental care in Australia, AIHW, Australian Government, accessed 28 July 2024. https://www.aihw.gov.au/reports/dental-oral-health/oral-health-and-dental-care-in-australia/contents/priority-populations/people-with-additional-and-or-specialised-health-c
Revision And Conclusion15
Summary of Topics16
- Concepts of burden of disease
- Identifying priority population
- Burden of disease among priority groups and describing reasons.
Lecturer — Lecture Review
The lecture reinforced the DALY concept and identified priority populations described by the Australian Institute of Health and Welfare.
- Challenges included limited access to dental practitioners, clinical infrastructure, transport, fluoridated water, healthy food, and oral hygiene products.
- The four priority populations with additional or specialised oral care needs were people living with mental illnesses, people living with disabilities, people living with complex medical conditions, and frail older people.
- Rural and very remote communities had oral disease DALY rates nearly 1.6 times higher than major cities, with higher burdens of dental caries, periodontal disease, and lip and oral cavity cancer.
- The next recording was stated to focus on problems in the oral healthcare system, their reasons, and enablers for improving services for priority populations.
*I
Footnotes
-
Original PDF page 1: L2.2 Burden of Oral disease among ruralremote communities and those wiht special care needs slides, p.1 ↩
-
Original PDF page 2: L2.2 Burden of Oral disease among ruralremote communities and those wiht special care needs slides, p.2 ↩
-
Original PDF page 3: L2.2 Burden of Oral disease among ruralremote communities and those wiht special care needs slides, p.3 ↩
-
Original PDF page 4: L2.2 Burden of Oral disease among ruralremote communities and those wiht special care needs slides, p.4 ↩
-
Original PDF page 5: L2.2 Burden of Oral disease among ruralremote communities and those wiht special care needs slides, p.5 ↩
-
Original PDF page 6: L2.2 Burden of Oral disease among ruralremote communities and those wiht special care needs slides, p.6 ↩
-
Original PDF page 7: L2.2 Burden of Oral disease among ruralremote communities and those wiht special care needs slides, p.7 ↩
-
Original PDF page 8: L2.2 Burden of Oral disease among ruralremote communities and those wiht special care needs slides, p.8 ↩
-
Original PDF page 9: L2.2 Burden of Oral disease among ruralremote communities and those wiht special care needs slides, p.9 ↩
-
Original PDF page 10: L2.2 Burden of Oral disease among ruralremote communities and those wiht special care needs slides, p.10 ↩
-
Original PDF page 11: L2.2 Burden of Oral disease among ruralremote communities and those wiht special care needs slides, p.11 ↩
-
Original PDF page 12: L2.2 Burden of Oral disease among ruralremote communities and those wiht special care needs slides, p.12 ↩
-
Original PDF page 13: L2.2 Burden of Oral disease among ruralremote communities and those wiht special care needs slides, p.13 ↩
-
Original PDF page 14: L2.2 Burden of Oral disease among ruralremote communities and those wiht special care needs slides, p.14 ↩
-
Original PDF page 16: L2.2 Burden of Oral disease among ruralremote communities and those wiht special care needs slides, p.16 ↩
-
Original PDF page 15: L2.2 Burden of Oral disease among ruralremote communities and those wiht special care needs slides, p.15 ↩