Andreasen 1982 - Dental Injuries by Sport
Contextual takeaway
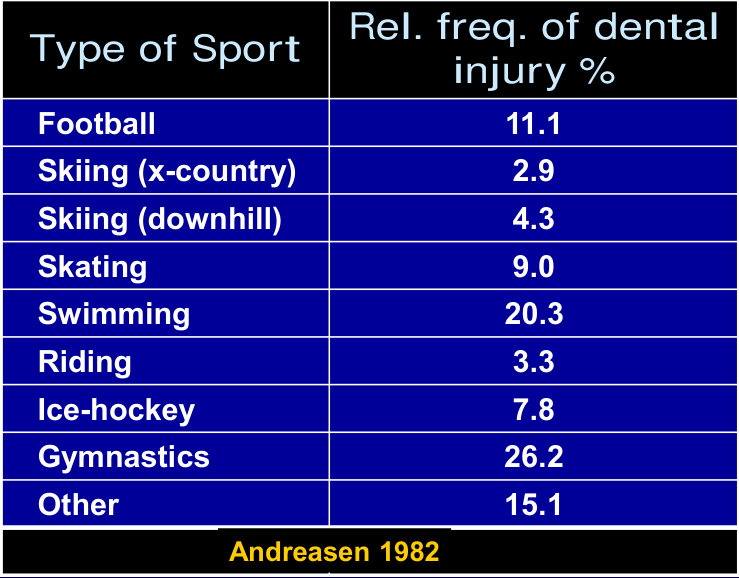
In this lecture chart, the highest reported relative frequencies were for gymnastics (26.2%) and swimming (20.3%); no athlete-exposure denominator is provided, so the figures do not estimate participant-level risk.
Citation and evidence type
L3 labels the chart “Andreasen 1982” but supplies no full reference or study frame (population, sample, method, or denominator). It appears as a distinct block after the separate Crona-Larson (1989) sex chart and before the Stockwell (1988) school-service material. The evidence preserved here is the lecture’s relative-frequency table and chart.
Relative Frequency of Dental Injury by Sport1
Source: L3 - Relative Frequency of Dental Injury by Sport (pre-edit lines 185-199 and 210).
| Type of Sport | Rel. freq. of dental injury % |
|---|---|
| Football | 11.1 |
| Skiing (x-country) | 2.9 |
| Skiing (downhill) | 4.3 |
| Skating | 9.0 |
| Swimming | 20.3 |
| Riding | 3.3 |
| Ice-hockey | 7.8 |
| Gymnastics | 26.2 |
| Other | 15.1 |
Source figure caption: “Type of Sport / Rel. freq. of dental injury %” (footer: “Andreasen 1982”).
Original lecture PDF, page 7:
Footnotes
-
Original lecture PDF page 7: L3 lecture, p. 7 ↩