Crona-Larson 1989 - Dental Trauma Causes by Sex
Citation and provenance
The L3 chart is labeled Crona-Larson 1989. The lecture supplies no paper title, journal, author initials, study design, source population, sample size, or exposure denominator. It identifies the plotted measure only as “per cent individuals”; the citation is retained at that level rather than completed.1
Contextual takeaway
The chart displays higher percentages for girls in the bicycle and fall categories, higher percentages for boys in violence and sports, and similar miscellaneous bars. These descriptive chart proportions do not estimate injury risk per participant; the lecture provides no activity-exposure denominator.
Chart data
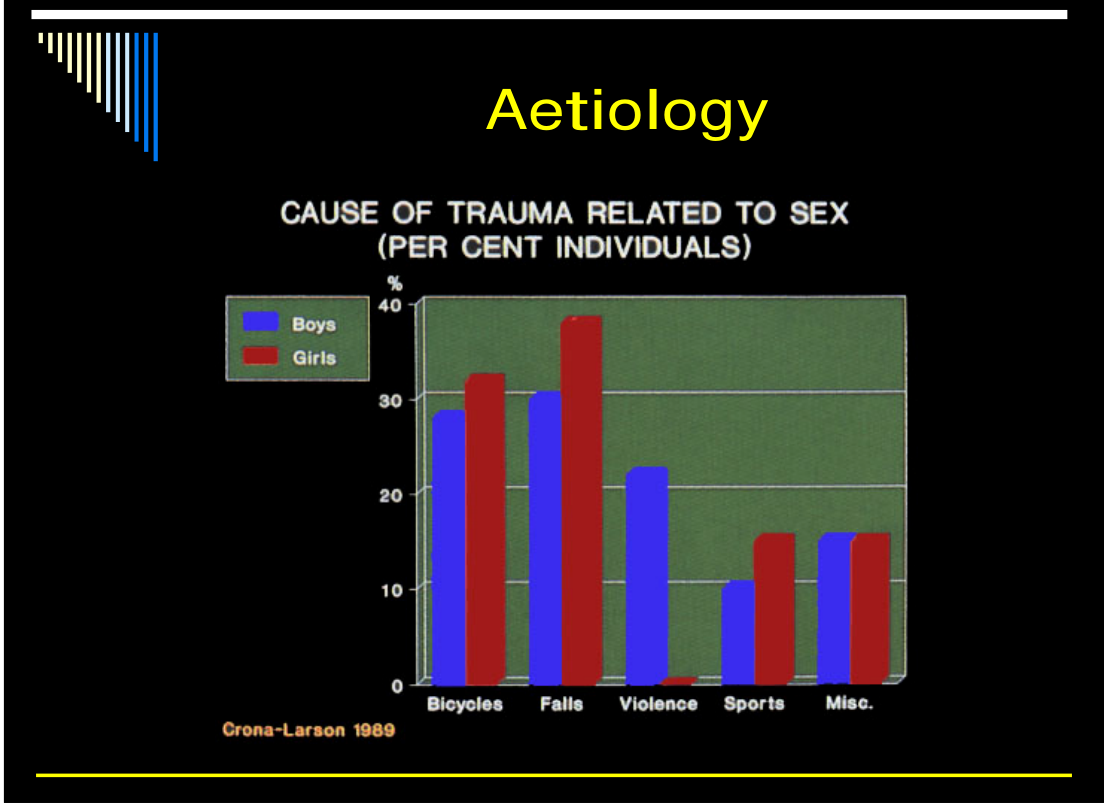
Caption: Cause of Trauma Related to Sex (Per Cent Individuals). Crona-Larson 1989.
| Cause category | Boys (approx. %) | Girls (approx. %) |
|---|---|---|
| Bicycles | ~29 | ~33 |
| Falls | ~31 | ~39 |
| Violence | ~23 | ~0 |
| Sports | ~11 | ~16 |
| Misc. | ~16 | ~16 |
Bar heights are visual estimates read against the chart’s 0-40% axis with 10% grid lines; the source figure prints no numeric labels. The lecture does not state the sample size or exposure denominator.
L3 lecturer commentary
Lecturer interpretation
- Girls were somewhat more likely to fall from bicycles or fall over and injure themselves.
- Boys were much more likely to be involved in violence and had a higher incidence of sport-related injuries.
- Injuries associated with playing were similar between the genders.
These are the lecture’s comments, not separately verified publication details. The visually estimated sports bars above differ from the lecturer’s stated sex pattern; both source representations are preserved pending verification.
Source
The chart and accompanying text appear in the L3 source section. The corresponding original PDF page is embedded below.
Footnotes
-
Original PDF page 6: L3 source lecture, original PDF p. 6. ↩