Lam et al 2008 - Dental Trauma at a Rural Australian Centre
Contextual takeaway
Lam and colleagues described a 66-month series of dental-trauma patients seen at a private general dental practice serving Bunbury and its surrounding area. The cohort shows the range of injuries and varied presentation times in a rural referral setting. The timing data describe when patients presented; they do not show that delay caused harm. The lecturer emphasized that urgency depends on injury type and that prompt assessment matters because visible appearance alone may not reveal the full injury.12
Citation and source
Lam R, Abbott PV, Lloyd C, Lloyd C, Kruger E, Tennant M. Dental trauma in an Australian rural centre. Dent Traumatol. 2008;24:663–670. The lecture prints Lloyd C twice in its author citation; that wording is retained here.1
The study summary and figures below are transcribed from L3, “Dental Trauma in an Australian Rural Centre,” pp. 11–21. L13 separately cites the Bunbury cohort in its root-fracture comparison on p. 4.3
Setting and recruitment
- Location: Bunbury, Western Australia, about 200 km south of Perth. Bunbury had a population above 30,000, with surrounding areas in a total service “feed” area of about 100,000.
- Service: a private general dental practice with a special interest in trauma, an after-hours on-call service, and links with the local general hospital and doctors. The practice was known to the community, other dentists, hospital and local doctors; patients with dental trauma seen at a hospital or medical practice were commonly referred there.
- Study period: May 2000 to December 2005 (66 months).
- Sample: 323 consecutive patients with injuries to teeth and/or mouths; about 5 patients per month or more than 1 per week.
This is a consecutive series at one practice, not a population-wide count. The lecturer noted that trauma is relatively infrequent for an individual dentist and compared keeping knowledge current with regularly updating basic life-support skills.1
Patients and injured teeth
| Measure | Reported result |
|---|---|
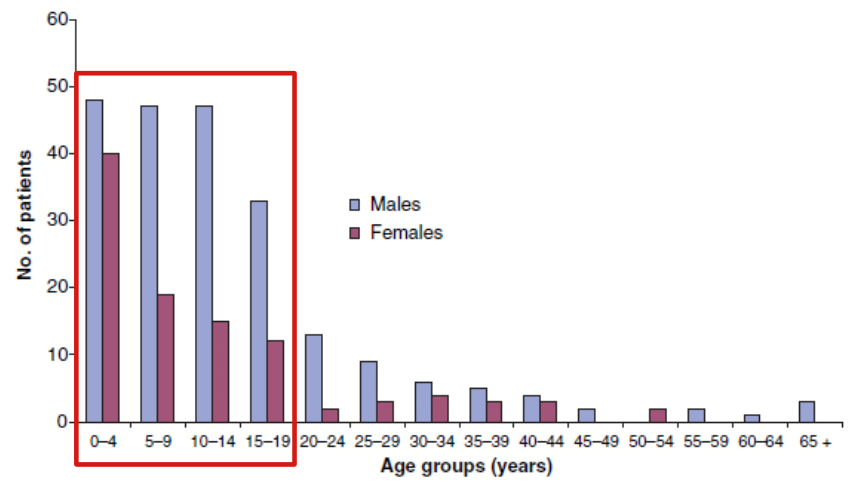
| Sex | 68% male and 32% female; reported as a significant difference |
| Age | 10 months to 78 years; 92% were younger than 34 |
| Mean age | Males 14.1 years; females 11.6 years |
The age figure plots patient counts by sex and age group. Its original caption is retained in the embed.4
The lecture reports 528 injured teeth, comprising 368 permanent teeth (70%) and 159 deciduous teeth (30%). The two dentition subtotals add to 527, one fewer than the stated total; all three source values are retained as reported. The average was 1.7 injured teeth per patient, with a range of 1–6.56
| Injured teeth per patient | Patients |
|---|---|
| 1 | 58.2% |
| 2 | 24.8% |
| 3 | 9.3% |
| 4 | 5.1% |
| 5 | 2.3% |
| 6 | 0.3% |
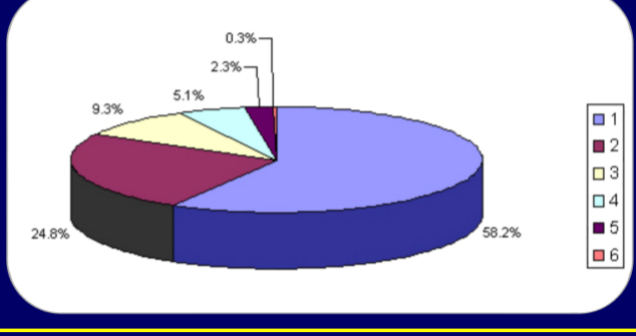
The lecturer added that 58% of patients had one injured tooth. In permanent teeth, maxillary central incisors accounted for 44% of all study teeth, maxillary lateral incisors 13%, mandibular central incisors about 7%, and mandibular lateral incisors about 3%. In deciduous teeth, maxillary central incisors accounted for 22% and maxillary lateral incisors 5%; mandibular incisor injuries were very uncommon.56
Soft-tissue injuries
Of the patients, 116 had soft-tissue injuries: 108 had soft-tissue injuries concurrent with other injuries, and 8 had soft-tissue injuries only. The lecturer noted that a blow to facial soft tissues may also injure underlying teeth and bone; the lips are often between the impacting object and the teeth.6
Timing of accidents
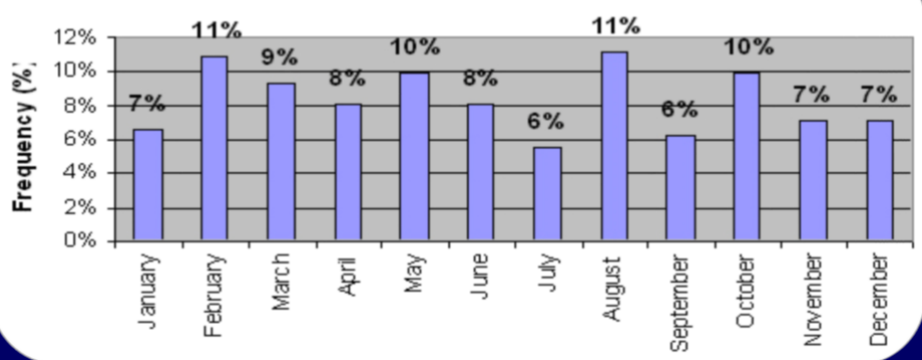
The study summary reports no significant difference by weekday, month or season. The lecturer said the expected winter increase from contact sports was not supported. Friday, Monday and Thursday were slightly higher in the weekday figures, but the differences were not statistically significant.78
| Weekday | Share |
|---|---|
| Sunday | 9% |
| Saturday | 11% |
| Friday | 20% |
| Thursday | 16% |
| Monday | 17% |
| Tuesday | 13% |
| Wednesday | 14% |
For months, the lecture’s text and embedded chart give different values. Both are preserved below; the source also says “0% also shown” in its text without identifying the month.
| Month | Lecture text | Embedded monthly chart |
|---|---|---|
| January | 12% | 7% |
| February | 11% | 11% |
| March | 11% | 9% |
| April | 10% | 8% |
| May | 10% | 10% |
| June | 9% | 8% |
| July | 8% | 6% |
| August | 8% | 11% |
| September | 7% | 6% |
| October | 7% | 10% |
| November | 7% | 7% |
| December | 6% | 7% |
The embedded figure is a monthly bar chart. The original alt text in the lecture describes a weekday pie chart, so that caption is retained verbatim while the chart/text mismatch is made explicit.
Causes and injury types
| Cause | L3 prose value | Embedded chart value |
|---|---|---|
| Assault | 25.7% | 6.8% |
| Bike | 22.9% | 7.7% |
| Fall | 15.8% | 25.7% |
| MVA | 12.7% | 2.2% |
| Other | 7.7% | 12.7% |
| Play | 6.8% | 22.9% |
| Sport | 2.2% | 15.8% |
| Work | 6.2% | 6.2% |
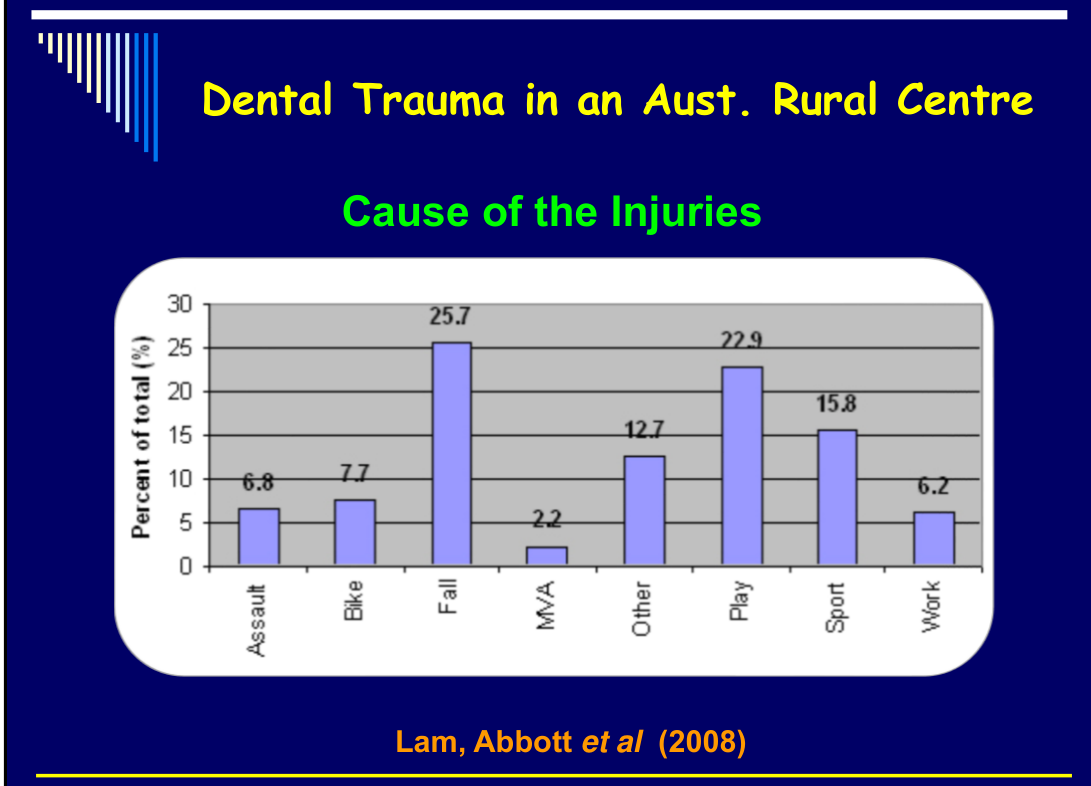
The prose assignments and the plotted chart labels disagree for all causes except Work. Both are retained without choosing which representation is correct; the chart percentages are transcribed from its visible labels.
The lecture describes significant differences when causes were compared within each dentition: sports and accidents while playing were significant for permanent teeth; falls and accidents while playing were significant for deciduous teeth. The denominator for “percent of total” is not specified in this L3 excerpt.910
L3 also includes a “Cause of Injury Related to Gender” heading but supplies no gender-stratified values in this excerpt.10
Lam, Abbott et al. (2008): Cause of the Injuries.
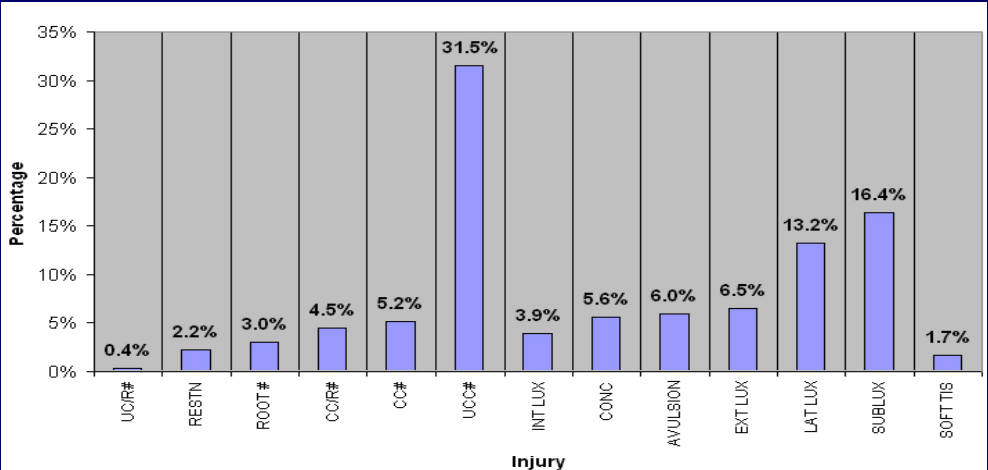
The most common injury types were uncomplicated crown fracture (31.5%), subluxation (16.4%) and lateral luxation (13.2%); the lecture says the pattern was similar for permanent and deciduous teeth.
| Original chart label | Percentage |
|---|---|
| UCR# | 0.4% |
| RESTN | 2.2% |
| ROOT# | 3.0% |
| CCR# | 4.5% |
| CC# | 5.2% |
| UCC# | 31.5% |
| INT LUX | 3.9% |
| CONC | 5.6% |
| AVULSION | 6.0% |
| EXT LUX | 6.5% |
| LAT LUX | 13.2% |
| SUBLUX | 16.4% |
| SOFT TIS | 1.7% |
The abbreviated labels are reproduced as drawn, without assigning expansions not given in this lecture excerpt.11
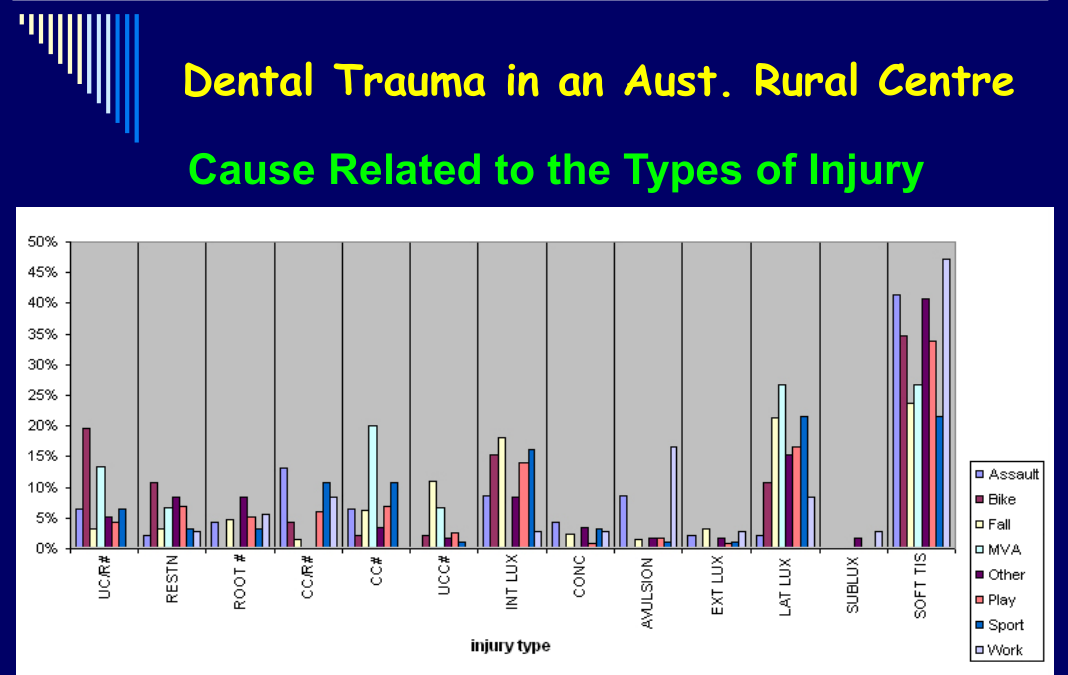
The next chart cross-tabulates the same cause categories (Assault, Bike, Fall, MVA, Other, Play, Sport, Work) against the original injury-type labels (UCR#, RESTN, ROOT#, CCR#, CC#, UCC#, INT LUX, CONC, AVULSION, EXT LUX, LAT LUX, SUBLUX, SOFT TIS), with percentage on a 0–50% axis. The source figure is retained; no additional numeric values are inferred from the plotted bars.12
Time to presentation and clinical teaching
The lecture summarizes presentation as about one-third within 24 hours (same day or overnight), another third within 1 week, and another third after weeks or months, up to 1 year. Its detailed distribution is:
| Time since injury | Patients |
|---|---|
| Less than 1 day | 36% |
| 2 days | 10% |
| 3 days | 5% |
| 4 days | 3% |
| 5 days | 4% |
| 6 days | 1% |
| 1 week | 8% |
| 2 weeks | 8% |
| 2–4 weeks | 11% |
| 4–12 weeks | 12% |
| 12–52 weeks | 2% |
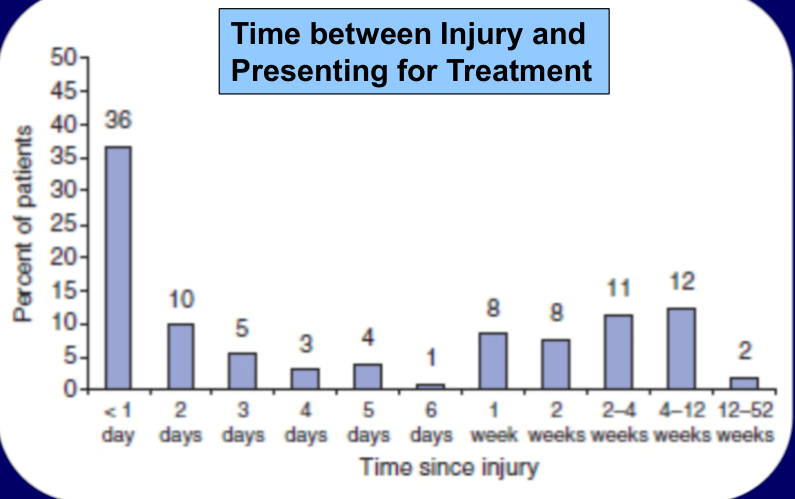
The lecturer taught that consequences depend on injury type. Delay may be less important for uncomplicated crown fractures, infractions, concussion and subluxation, while avulsion, lateral luxation, extrusion and other severe injuries are time-critical. Patients should be encouraged to seek care as soon as possible because visual appearance alone cannot establish injury extent. Assessment may include examination of teeth and surrounding tissues, radiographs and pulp testing; radiographs may reveal root, alveolar-process or other bone fractures.2
L13 root-fracture comparison
In its root-fracture lecture, L13 lists the Lam, Abbott et al. (2008) Bunbury, WA cohort as 3.0% of injuries (children and adults) in its comparison of root fractures among injury data. This is the L13 context for that value; it is separate from the L3 injury-type chart above.3
Evidence limits
The figures describe this practice’s 323 consecutive patients over 66 months. The lecture supplies no population incidence estimate or outcome comparison by delay. Presentation time alone should not be used to infer that delay caused harm.
Footnotes
-
Original L3 PDF page 11: L3 Dento-Alveolar Trauma 2 - Aetiology, Epidemiology and Mechanisms of Injuries to the Teeth, p.11 ↩ ↩2 ↩3
-
Original L3 PDF page 21: L3 Dento-Alveolar Trauma 2 - Aetiology, Epidemiology and Mechanisms of Injuries to the Teeth, p.21 ↩ ↩2 ↩3
-
Original L13 PDF page 4: L13 Dento-Alveolar Trauma 6 - Managing Root Fractures, p.4 ↩ ↩2
-
Original L3 PDF page 12: L3 Dento-Alveolar Trauma 2 - Aetiology, Epidemiology and Mechanisms of Injuries to the Teeth, p.12 ↩
-
Original L3 PDF page 13: L3 Dento-Alveolar Trauma 2 - Aetiology, Epidemiology and Mechanisms of Injuries to the Teeth, p.13 ↩ ↩2
-
Original L3 PDF page 14: L3 Dento-Alveolar Trauma 2 - Aetiology, Epidemiology and Mechanisms of Injuries to the Teeth, p.14 ↩ ↩2 ↩3
-
Original L3 PDF page 15: L3 Dento-Alveolar Trauma 2 - Aetiology, Epidemiology and Mechanisms of Injuries to the Teeth, p.15 ↩
-
Original L3 PDF page 16: L3 Dento-Alveolar Trauma 2 - Aetiology, Epidemiology and Mechanisms of Injuries to the Teeth, p.16 ↩
-
Original L3 PDF page 17: L3 Dento-Alveolar Trauma 2 - Aetiology, Epidemiology and Mechanisms of Injuries to the Teeth, p.17 ↩
-
Original L3 PDF page 18: L3 Dento-Alveolar Trauma 2 - Aetiology, Epidemiology and Mechanisms of Injuries to the Teeth, p.18 ↩ ↩2
-
Original L3 PDF page 19: L3 Dento-Alveolar Trauma 2 - Aetiology, Epidemiology and Mechanisms of Injuries to the Teeth, p.19 ↩
-
Original L3 PDF page 20: L3 Dento-Alveolar Trauma 2 - Aetiology, Epidemiology and Mechanisms of Injuries to the Teeth, p.20 ↩